(T2108 measures the percentage of stocks trading above their respective 40-day moving averages [DMAs]. To learn more about it, see my T2108 Resource Page. You can follow real-time T2108 commentary on twitter using the #T2108 hashtag. T2108-related trades and other trades are posted on twitter using the #120trade hashtag)
T2108 Status: 56%
VIX Status: 21
General (Short-term) Trading Call: Hold
Commentary
For the past 8 trading days, T2108 ha essentially bounced between 50% and 60%. My favorite technical indicator has provided no guidance on a trading direction, so the trading call has remained at hold for quite some time. With the S&P 500 pressed against resistance, I fully expect trading opportunities to explode in the new year, starting with a quick burst into overbought territory for a false breakout followed swiftly by profit-taking and/or investors selling out of relief to get their money back from the August swoon. The start of another earnings season provides the largest caveat to this expectation.
Here is a review of where things stand with the S&P 500 and volatility…
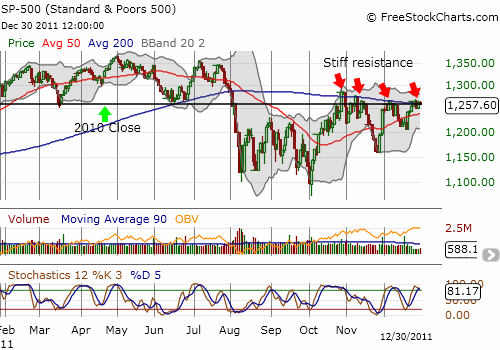
The S&P 500 continues to struggle to break free of the overhead resistance provided by the slightly declining 200DMA. It is now also contending with the flatline representing the 2010 close. This line served as neat support in the first half of 2010 and is now punishing the S&P 500 as resistance. Finally, stochastics are already in an overbought position. In the index’s favor? The 50DMA continues to rise sharply and on-balance volume (OBV) is on the rise again.

The current chart of the S&P 500 must fascinate every technician. The patterns here scream out at us. The pressure has mounted against resistance for two months providing easy trades for range traders. The two bounces from support in the first half of the year provided high-reward, low-risk setups. Am I saying in hindsight that these trades are obvious? No. I am saying that 2011 was full of the kinds of setups swing traders love. EACH trade ahead of time is as uncertain as any trade, always requiring the appropriate risk management: stop-loss levels and position-sizing. For example, the trade on support failed spectacularly in early August. Without a stop-loss, a swing trader would have forfeited all his/her hard-earned profits for the year within just three days! Note that I would not have bet on such a trade because I do not believe in triple bottoms. T2108 was oversold for a brief moment but did not close oversold. Review what I had to say at that critical moment here: “T2108 Update – August 3, 2011 (Brief Dip Into Oversold Territory).” Thank goodness I was skeptical of a market bottom!
T2108 was so successful in 2011 because the bounces through the ranges so often neatly coincided with support and resistance. T2108 kept traders out of trouble and away from excessive optimism at the highs, and it kept emotions and despair in check at the market lows. More on this later.
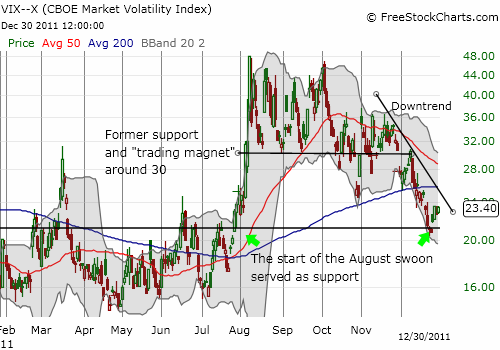
Next up, the volatility index, the VIX. Even as the August swoon becomes a distant memory, the VIX appears to cling to those fond memories. Even with the S&P 500 pressing its case for a breakout, the VIX is creeping upward off support formed by the beginning of the August swoon. This bounce warns us that a sharp rise in volatility remains a very real risk. However, the recent downtrend in the VIX over the last month stands in the way of a resumption of gut-curdling volatility. Moreover, the 200 and 50DMAs are likely to slow the VIX down. The developments in the VIX will be almost as important (and exciting) to watch as the developments for the S&P 500 and T2108. I am inclined to bet on the bounce continuing and working its way back to the former support and trading magnet level of 30. It is a very close call.

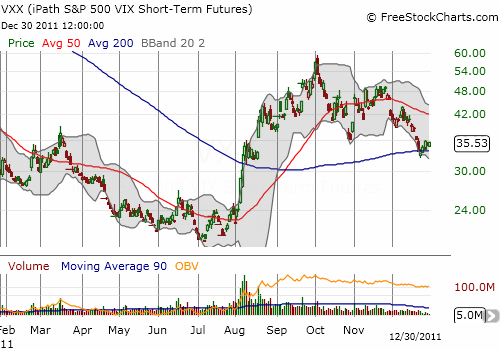
Similar to the VIX, VXX, the iPath S&P 500 VIX Short-Term Futures index, is bouncing off support. The VXX is bouncing off its 200DMA. Moreover, current levels provide strong support given the consolidation that occurred here in mid-August before VXX made a fresh surge higher with a gap up. I have been impressed that the VXX has remained aloft for so long. Remember that overall the VXX has careened downward since its introduction in January, 2009…at $400! (VXX has reverse split since then).

In summary, I expect the S&P 500 to finally breakout above current resistance after two months of trying, just out of sheer force, perhaps even out of some new year hopefulness (the most likely result for the first trading day of 2012 is a close between -1% and 1%). However, a stubborn VIX and overbought levels for T2108 will work strongly against a sustained rally. The subsequent selling should quickly bring everyone “back to reality.”
This projection brings me to the topic of forecasting. This is the time of year where prognosticators peer into their crystal balls to guess 12-month performance for their favorite indices. I hate these forecasts and pay little attention to them. It is hard enough to incorporate new information to keep short-term forecasts relevant as I attempt to do with T2108. I cannot even fathom trying to anticipate all the things that can happen in this volatile world over the course of 12 months.
The Psy-Fi blog lambasted financial forecasters in a December 27th post titled “Forecasting A Financial Earthquake: Guru-nomics“:
“Financial forecasters suffer from the same problems as earthquake forecasters – they don’t understand the underlying principles of what they’re trying to analyse. While the latter generally recognise this and have the sense to put in place the appropriate caveats the former mainly seem to be blind to the possibility of error. Of course, the fact that over-confident earthquake analysts may lose their careers and reputations while their equivalent in finance will merely have to wait another year to assay an attempt at guru status may have something to do with this.”
While I agree with the fundamental premise, I was a bit puzzled by the simultaneous claims that “…markets tend to rise about twice as much as they fall, likely an outcome of basic human overconfidence, then if you don’t have a clue what you’re doing it’s a pretty decent bet to guess markets will rise” and “A study by Paul Söderlind has shown that a panel of economists demonstrated no ability to predict the movements of the stockmarkets but nevertheless remained convinced that they had some skill in what is essentially an exercise in coin-tossing.” It seems to me that a rational economist should always project an up-market unless he has some extremely strong evidence to the contrary (nevermind the damage done by the magnitude of the inaccuracy). The stock market performs much better than a simple coin toss.
In fact, the prime directive of long-term investing assumes that given enough time, the returns for investing in stocks are positive and high enough to warrant the risks involved. This is a bold forecast which is supported by the historical performance of the stock market (nevermind that history is very short compared to the timeline of all human history).
Having said all that, it is still fun to try long-range forecasting.
On January 1, 2011, a friend of mine challenged me to a friendly contest to make year-end predictions. His point was not to beat me in accuracy but instead to prove that such an exercise is useless and pointless, that a well-balanced portfolio is the only rational approach to investing. As he recently admitted, making inaccurate forecasts would prove his point, making accurate forecasts would be attributed to luck. In other words, it might take 30 accurate forecasts (maybe infinite?) in a row to “prove” any skill at forecasting. Nassim Taleb makes a similar point in “Fooled by Randomness: The Hidden Role of Chance in Life and in the Markets” as he casts aspersions on mutual fund managers for the questionable value they provide over simple indexing.
Just for reference, here is what I guessed for the end of 2011:
- S&P 500 1310 (actual 1257.60)
- Gold $1475 (actual $1564.80)
- 10-year t-bill 4% (actual 1.89%)
I find it funny how I under-estimated gold given I have remained a staunch bull on gold all year. I should have over-estimated it. However, a long-range forecast compels the prudent to be conservative in order to accommodate all the innumerable things that can go wrong with a fundamental thesis. My training in T2108 keeps me from getting attached to any specific point target in the S&P 500. I am most shocked at how close I came to the S&P 500. I am most disappointed at completely blowing the interest rate prediction primarily because there was so much money to be made in 2011 on being a T-bill bull. Mind you, I did NOT trade on these point forecasts – the ultimate test of conviction. Instead, these predictions represented my directional biases at that time.
I am a firm believer in the benefits of long-term investing, especially when it comes to taking advantage of bargains when the market offers them (see for example my blog posts on the “commodity crash playbook“). The best ideas seem to require a LOT of patience to produce returns commensurate with the associated risks. But I also believe it is possible to profit around the edges and to better manage risk around the edges. This is where T2108 trading fits in.
I have long followed T2108 since a friend introduced me to the indicator in 2003 or so. Unfortunately, I have only just recently become systematic in using T2108 in trading and investing. I produced my first analysis of T2108 in July, 2008. In February, 2011, I finally organized my T2108 commentary in an easy-to-find way on the T2108 Resource Page. In May, I finally created the T2108 Update as a regular feature in this blog.
FINALLY, FINALLY, I created a completely separate account focused strictly on T2108 trading, my demonstration of conviction in the usefulness of T2108. I can now track much more carefully the success and performance of my T2108 assessments. My first trade in this account was on August 5, just as the August swoon accelerated to the downside – clearly, a very auspicious start! Yikes! If you have followed the T2108 trades on twitter or here on the blog, you know that these trades have sometimes been difficult to make, but I resolved to stick by the rules I have carefully developed from my analyses.
The results so far are very encouraging. While placing no more than 39% of my capital at risk at any one time, I was able to generate a return of 6.7% in less than 5 months. If I calculate that return over the maximum capital at risk, I get a performance of 16.9%. Annualized, these returns are approximately 16.1% and 40.7%. My T2108 trades in this account only used SSO, SDS, and VXX shares, no options. Are these fabulous returns sustainable? Time will tell, and I will do my best to provide periodic reports.
2011 was a very rewarding year for T2108 trades exactly because it was a range-bound year. T2108 is all about playing against the grain of extremes in market sentiment, whether greed or fear. What could go wrong? The worst scenario for T2108 trading is a long and extended trend either up or down AFTER closing out trades in the direction of the trend. For example, I long ago closed out bullish trades from T2108 oversold conditions. I am now positioned for a pullback. If the S&P 500 rallied from current levels and stayed overbought for the next 12 months, I will get stopped out of my bearish positions, but I will also miss out on tremendous upside. This is an extremely unlikely scenario, but some kind of extended rally is always possible. See “Trading Strategies for an Overbought S&P 500 Using the Percentage of Stocks Trading Above Their 40DMAs (T2108)” for more details on the history of overbought periods for more details. In that piece, I also propose a method for attempting to participate in some of the gains of stubbornly persistent overbought conditions. I hope never to get tested on THAT scenario!
Most importantly, note well that 2011 delivered an unusual number of oversold and overbought conditions. We should NOT expect these many opportunities going forward. For example, in 2010, I recognized that the market seemed to bottom once T2108 reached 30% instead of the standard oversold levels. Such adjustments are necessary if market conditions require it. As always, I will support any rule changes with data and analysis.
So, the goal for 2012 is to remain disciplined with the application of T2108 trading AND to maintain the open-minded flexibility to recognize when conditions require creative adjustments and/or new analyses. Here is to a prosperous new year!
Charts below are the latest snapshots of T2108 (and the S&P 500)
Refresh browser if the charts are the same as the last T2108 update.
Black line: T2108 (measured on the right); Green line: S&P 500 (for comparative purposes)
Weekly T2108

*All charts created using freestockcharts.com unless otherwise stated
Related links:
The T2108 Resource Page
Expanded daily chart of T2108 versus the S&P 500
Expanded weekly chart of T2108
Be careful out there!
Full disclosure: long SDS, GLD, TBT, and VXX


Doctor, Why does the 2108 chart in the Aug 3 update show 19.51 if it “did not close oversold?”
You catch everything! Notice the date on the chart. It is from September. The real mistake is that this chart does not show the latest. I switched to a new convention so that the chart always shows the latest T2108 values to make it a lot easier for me to manage chart updates. Sorry for the confusion. You can always check on T2108 at freestockcharts.com…