This is an excerpt from an article I originally published on Seeking Alpha on January 1, 2012. Click here to read the entire piece.)
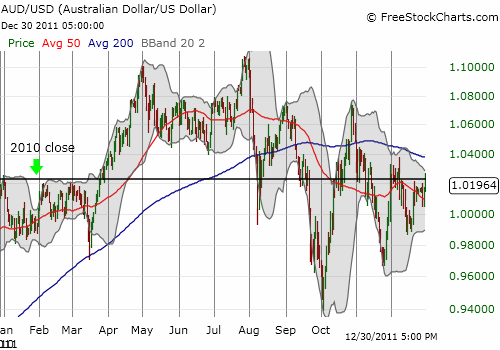
At the end of 2010, the Australian dollar closed at an all-time high against the U.S. dollar; the Aussie gained 14% and yielded 4.75% (for more details see “The Australian Dollar Ends the Year with A Flourish“). At the end of 2011, the Aussie closed almost exactly where it ended 2010. This time, the currency yields 4.25%, and it is DOWN from new all-time highs at 1.10650 versus the U.S. dollar (set August 1st).

2011 is also now the second year in a row where the Australian dollar has performed similarly to the S&P 500 (SPY). {snip} Unlike the Australian dollar, the S&P 500’s gyrations around flatline have been a clear story of first half versus the second half of the year. {snip}

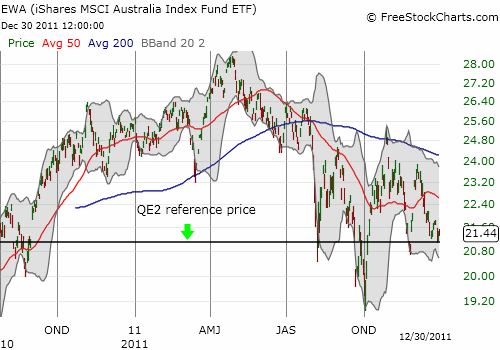
The difference in dividends continues to support my strong preference for Australian dollars over U.S. stocks, especially if strong correlations persist. In contrast, the ETF for Australian stocks, the iShares MSCI Australian Index Fund ETF (EWA) lost 15.7% for 2011. At $21.44 it is trading close to the QE2 reference price of $21.06. As such, EWA triggered a fresh buy signal last week for the “commodity crash” portfolio (I announced the trade in my twitter feed with the #120trade hashtag).

Source of charts: FreeStockCharts.com
{snip}
Be careful out there!
This is an excerpt from an article I originally published on Seeking Alpha on January 1, 2012. Click here to read the entire piece.)
Full disclosure: long SDS, FXA, EWA
