(T2108 measures the percentage of stocks trading above their respective 40-day moving averages [DMAs]. To learn more about it, see my T2108 Resource Page. You can follow real-time T2108 commentary on twitter using the #T2108 hashtag. T2108-related trades and other trades are posted on twitter using the #120trade hashtag)
T2108 Status: 71%
VIX Status: 23 (essentially unchanged – last post incorrectly specified the VIX at 21)
General (Short-term) Trading Call: Close some bullish positions, begin/expand bearish positions
Commentary
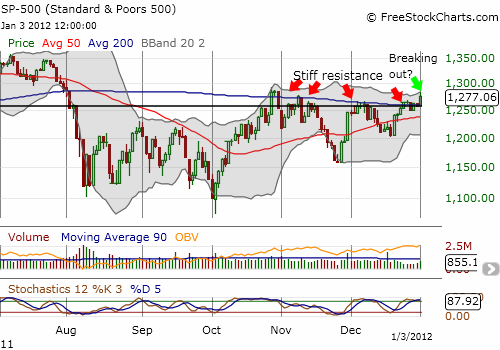
So after talking about the potential and perils of forecasting, I manged to nail a 2-for-2 today in terms of expectations. Not only did the S&P 500 rally strongly in a breakout formation, but also, T2108 finally cracked overbought levels, closing at 71%. These both met my expectations for this week, with a strong expectation that the year would start with a strong rally. The gain of 1.6% on the S&P 500 falls just outside the “typical” range for the first trading day of the year, so it becomes notable. I suspect bulls will take this as a great sign of things to come.

Today’s trading action IS important because it is the first time since October that any significant resistance level around the 200DMA has given way to buyers. Note in the chart above that the S&P 500 has not yet hurdled the last of these resistance levels which would be the highs from October. Such an event would return all the losses from the swoon that began in August and provide plenty of incentive for relieved investors to get out the market while they can. Stochastics are also overbought. Moreover, note well that the VIX did NOT decline significantly today, staying around 23 (VXX DID drop by 5% right to its 200DMA, making more careful about the bearish T2108 portfolio).
With T2108 overbought, I will begin expanding my bearish positions in the T2108 account. I will not yet get aggressive because I suspect the topping action will be a process, not an event. Year-beginning rallies can be sweet elixirs and earnings season is also right around the corner; I do not think bulls want to give up just as it appears prices are breaking out. For reference, the average overbought period lasts 9 days and the median duration is 4 days. If an overbought period extends past 9 days, I start to review my assessments more carefully. I will also re-evaluate if significant resistance breaks (the October highs or more importantly now, 52-week and multi-year highs).
In the meantime, I will continue to sell off trading longs (these are NOT in the T2108 trading account as referenced in the last post).
Charts below are the latest snapshots of T2108 (and the S&P 500)
Refresh browser if the charts are the same as the last T2108 update.
Black line: T2108 (measured on the right); Green line: S&P 500 (for comparative purposes)
Weekly T2108

*All charts created using freestockcharts.com unless otherwise stated
Related links:
The T2108 Resource Page
Expanded daily chart of T2108 versus the S&P 500
Expanded weekly chart of T2108
Be careful out there!
Full disclosure: long SDS and VXX

