(T2108 measures the percentage of stocks trading above their respective 40-day moving averages [DMAs]. To learn more about it, see my T2108 Resource Page. You can follow real-time T2108 commentary on twitter using the #T2108 hashtag. T2108-related trades and other trades are posted on twitter using the #120trade hashtag)
T2108 Status: 44%
VIX Status: 31
General (Short-term) Trading Call: Hold
Commentary
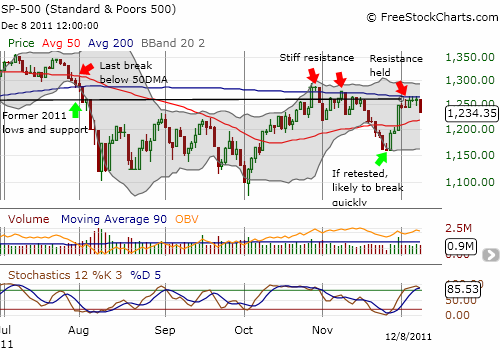
T2108’s equilibrium was disrupted in dramatic fashion today. T2108 plunged 22 percentage points to 44%. A resounding drop that reflects a rejection of overbought levels. However, this plunge was NOT matched by a plunge in the S&P 500. The index dropped “only” 2%, a pedestrian sell-off considering the volatility over the past four months. Given my bearish bias, I strongly suspect the index will play “catch-up” with the drop in T2108 given the 200DMA has yet again produced firm resistance the S&P 500’s advance.

Note well that stochastics are very overbought. This supports my bearish bias for more downside. If the selling takes the S&P 500 to the November lows, I doubt the support will last long. The index turned a sharp corner at the point with no time for buyers to accumulate and commit. Instead a small lucky few are sitting on profits, and they should be very eager to protect profits as the index approaches those lows.
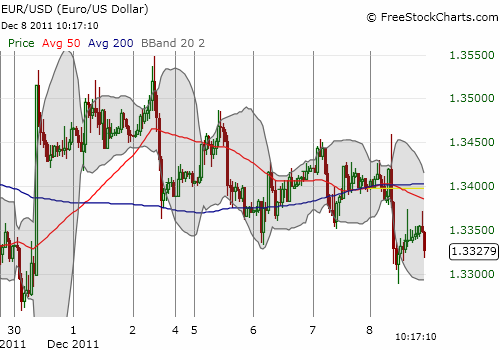
The euro also continues to confirm my bearish bias. I have chronicled my on-going skepticism of every euphoric pop in the currency (against the U.S. dollar). At the lows for the day, the euro had almost completely erased all its euphoric gains from last week. The hourly chart below clearly shows that the pop on Nov 30 represents just about the entire gain for the euro over the past 9 days. The fade has been a steady cascade, even stair step, downward, only visible if you were paying attention to the lack of follow-through to almost every outburst. Again, I think this is the mark of short-covering in an environment with unmotivated buyers.

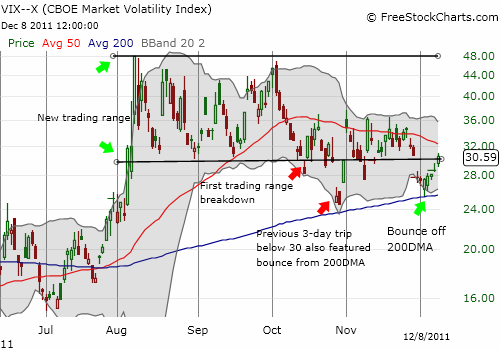
And as if we needed another bearish signal, the volatility index, the VIX, has jumped over 30 again. This level has proven to be quite a magnet for the index. Perhaps it is time we trade with a greater focus on this line as some sort of equilibrium point as long there is nervous sentiment in the air. The VIX spent 6 complete days below 30, the longest period since the August swoon. Symmetry suggests we now get around six days ABOVE this level. I am not projecting this behavior, but I am keeping the possibilities in the forefront of my observations. The VIX’s behavior at its 50DMA will be key. Note below that the 50DMA has served as a general cap on the VIX for about two months.

Finally, Groupon (GRPN) gained 5% today and is 10% above its original IPO price. This defiance of Thursday’s gravity demonstrates again the difficulty in using individual stocks to play T2108 (I emphasize using indices). The $20 level held as resistance for three days, but now the stock seems ready to make another run independent of the general market’s woes. Given my long-term bearishness in GRPN, I will continue to look for fresh entry points for puts and shorts (if I can ever get shares).
Charts below are the latest snapshots of T2108 (and the S&P 500)
Refresh browser if the charts are the same as the last T2108 update.
Black line: T2108 (measured on the right); Green line: S&P 500 (for comparative purposes)
Weekly T2108

*All charts created using freestockcharts.com unless otherwise stated
Related links:
The T2108 Resource Page
Expanded daily chart of T2108 versus the S&P 500
Expanded weekly chart of T2108
Be careful out there!
Full disclosure: long SDS and VXX; long VXX calls; net long U.S. dollar; net short euro; long GRPN puts

