(T2108 measures the percentage of stocks trading above their respective 40-day moving averages [DMAs]. To learn more about it, see my T2108 Resource Page.)
T2108 Status: 74%, 5th overbought day.
VIX Status: 16.
General (Short-term) Trading Call: Continue closing bullish trades (longs), add to bearish trades on a close below 1333 on the S&P 500 (shorts). Caveats noted below…
Commentary
T2108 dropped to 74%, but I thought it would drop completely out of overbought territory as the market first reacted violently to Friday’s poor jobs number. Friday’s performance put my comments from Thursday’s T2108 update in the spotlight (emphasis new):
“Given this confluence of data, short-term traders will find themselves at a very difficult juncture. The temptation to stick with the current trend will be very high. Yet, the risks for following this course are now rising fast and furiously. I will once again advocate sticking to rules and ignoring the news as much as is practical. For example, Doug Kass does a great job as always describing how the stock market is ignoring the strong economic and event risks in “The Bizarro Market.” If you had let the fundamentals scare you, you never would have followed the T2108 rules to buy into June’s oversold conditions. Similarly, there are happy bulls somewhere out there now boldly proclaiming that the market is cheerfully climbing the wall of worry and providing solid-sounding reasons to counter all of Kass’s concerns. Pinch yourself if you find the current rally increasing your willingness to listen to such happy talk.“
This is now the fifth day of this overbought period. The average overbought duration is about 8.9 days and the median is 4.5 days. So, although buyers put on a good show in closing the S&P 500 above Thursday’s low (and running Apple {AAPL} right back to flatline in the first 30 minutes of trading and a positive close), this overbought period should be much closer to its end than its beginning.
Note that the S&P 500 has now gone nine straight days without closing below the previous day’s low. So, technically, bulls remain firmly in control despite Friday’s bout of sharp selling. Such a close is key for anyone abstaining from shorting until the market shows some real weakness. Apple’s performance remains key to watch. If I had quickly enough absorbed the implications of Apple’s intraday performance, I might have speculated on a bounce for the general market and/or speculative stocks. Instead, I was more focused on watching to see whether the market had enough selling momentum to close below Thursday’s low…which was best since I have not yet developed any formal rules for trading other stocks based on Apple’s stock.
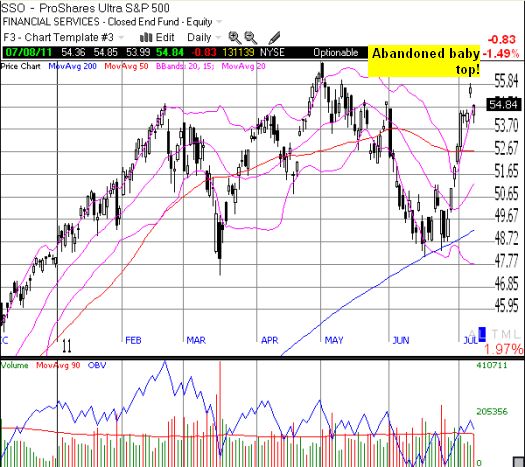
The most interesting feature of Friday’s trading was the appearance of many patterns of “abandoned baby tops.” On day one of this pattern, the stock or index has a strong rally. On day two, price gaps up strongly with a small range of trading for the rest of the day. The last day, the stock or index gaps down strongly and closes near its low, returning prices toward (or below) the low the day prior to the up gap. The last buyers of the rally feel “trapped” given the instant losses suffered on the gap down. These now nervous buyers become motivated sellers who dump with relief as soon as prices approach their entry point. In this way, the top of the pattern becomes stiff resistance. It is very bullish for prices to soon overcome this resistance. However, this pattern is particularly dangerous during an overbought period such as now because many buyers have been piling into the market for some time, and the topping pattern may represent the last of the motivated buyers.
The abandoned baby top does not show up on the major indices because of the strong buying from the bottom which forced prices above the open. SSO shows the closest resemblance. I found a few stocks that did not participate much in the late rally which show the abandoned baby top pattern much more clearly.

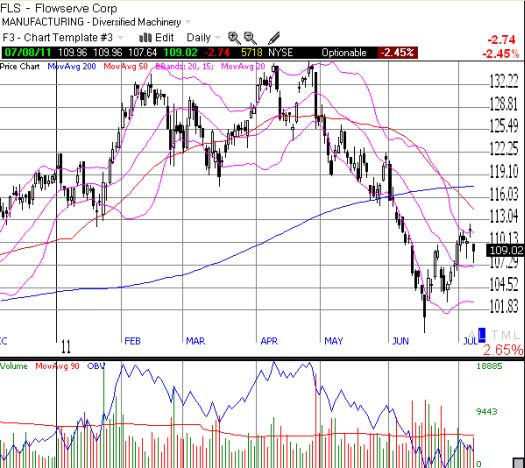
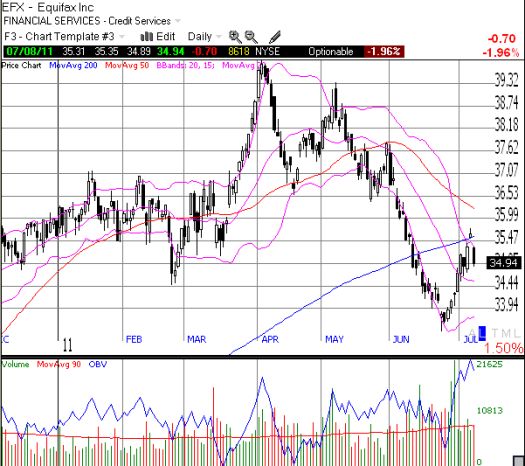
Here are some stocks that show the abandoned baby top very clearly and are good short candidates. Again, look at the last three days of trading. Stocks that remain below their 50 and/or 200DMAs are in particular trouble.


And even where buyers took stocks off the lows, many stocks are still left with confirmed topping patterns with the significant gap down following a “shooting star” pattern. Caterpillar (CAT) shows this best:

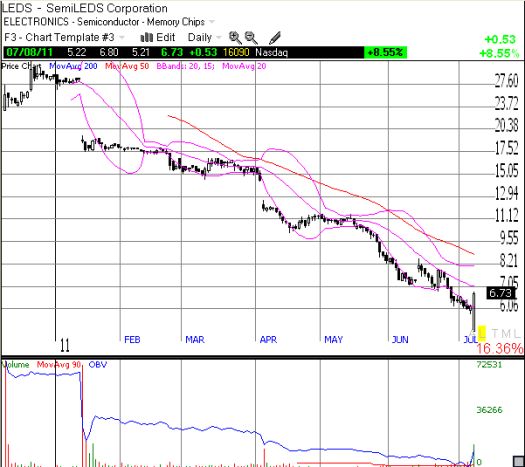
Finally, just to make sure you are paying attention and recognize that each individual stock must still be considered on its own merits, here is one of the clearest bottoming attempts you will see in a stock: an awful earnings report gaps SemiLEDS Corporation (LEDS) down over 11%. Next, buyers immediately step in and completely reverse the stock to close it UP 8.6%. This “bullish engulfing pattern” comes at the end of a near steady sell-off since the company IPO’d last December. The stock has lost a gut-wrenching 74% since the close of the first day of trading. It seems the stock may have finally exhausted its last significant seller.

On a quick sidenote, I have been continually perplexed by the poor performance of LED companies like LEDS and Cree Incorporated (CREE) given GT Solar (SOLR) has been ramping up sales of its LED equipment. Someone is predicting a big upturn in this business someday soon in the future. A bottom in LEDS should confirm my suspicion.
For a final twist, read here for my one firm short-term bullish call outside of commodities: “How to Play Research In Motion’s Imminent Buyback.”
Charts below are the latest snapshots of T2108 (and the S&P 500)
Refresh browser if the charts are the same as the last T2108 update.
Daily T2108 vs the S&P 500

Black line: T2108 (measured on the right); Red line: S&P 500 (for comparative purposes)
Weekly T2108

*All charts created using TeleChart:

Related links:
The T2108 Resource Page
Expanded daily chart of T2108 versus the S&P 500
Expanded weekly chart of T2108
Be careful out there!
Full disclosure: long puts on SSO, CAT, and FLS; long LEDS; long SOLR calls; net long RIMM
