
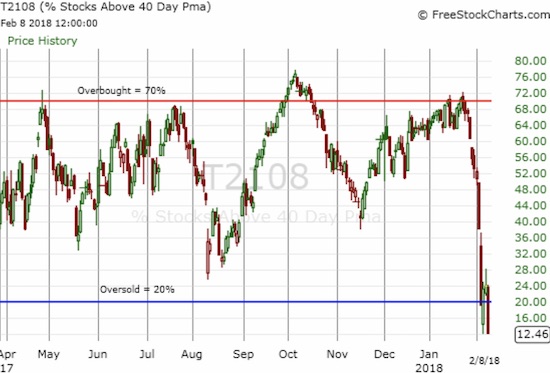
AT40 = 12.5% of stocks are trading above their respective 40-day moving averages (DMAs) (day 1 of the second oversold period in 4 days)
AT200 = 39.2% of stocks are trading above their respective 200DMAs (near 2-year low)
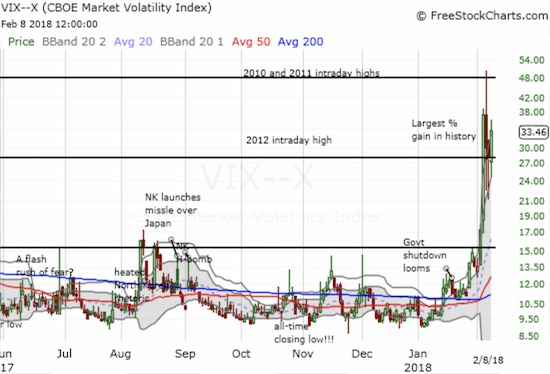
VIX = 33.5 (range from 24.4 to 36.2)
Short-term Trading Call: cautiously bullish (with oh so many caveats)
Commentary
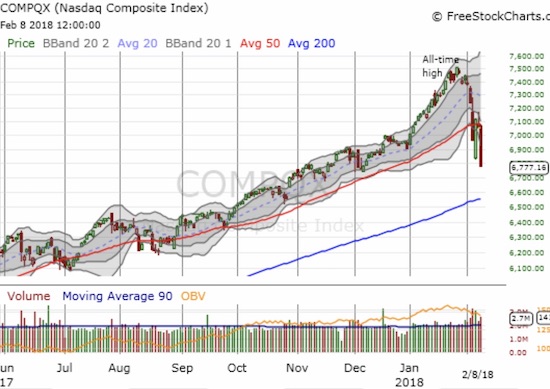
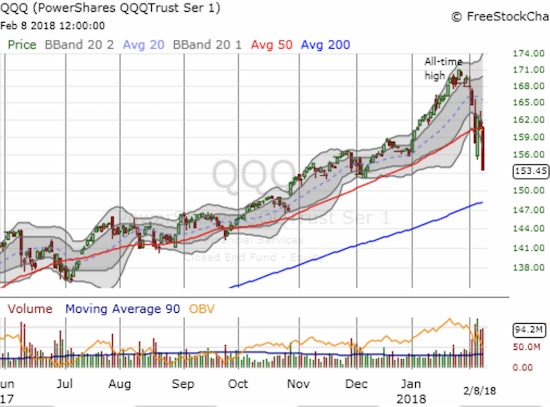
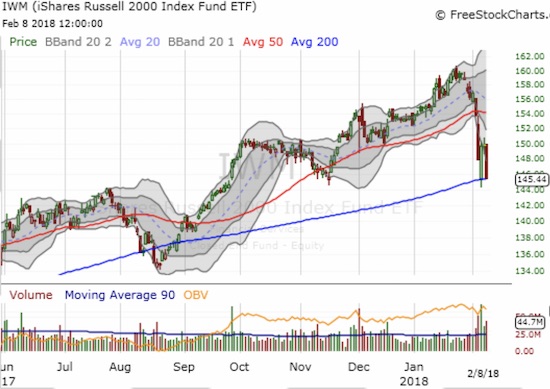
As I feared, sellers followed through on the failure of the major indices at their respective 50-day moving averages (DMAs). The S&P 500 (SPY) plunged 3.8% and set a new 3-month low, the NASDAQ lost 3.9% with a 2-month low, and the PowerShares QQQ ETF (QQQ) also hit a 2-month low with a 4.2% loss. I braced myself for a retest of the lows set just on Monday. However, I thought buyers would give up more of a fight to hold there. Instead, all these indices slid right past even the intraday low on Tuesday. This is bearish trading action. The iShares Russell 2000 ETF (IWM) is already testing 200DMA support for the second time this week.
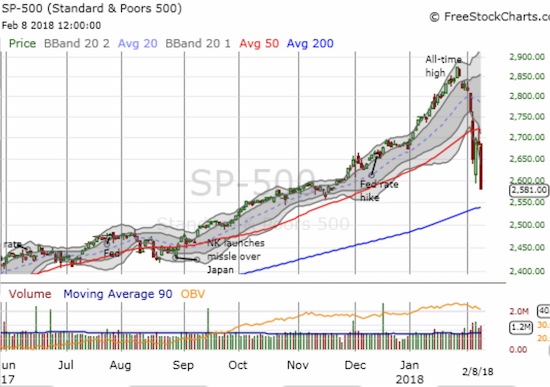
The selling drove my favorite technical indicator back into oversold territory. AT40 (T2108), the percentage of stocks trading above their respective 40DMAs, closed at 12.5%. This was the lowest close since the early 2016 sell-off that generated the last oversold period prior to this week. AT200 (T2107), the percentage of stocks trading above their respective 200DMAs, closed at 39.2%, a near 2-year low. Sellers are making a statement.
While the indices dropped to their lows of the current cycle of angst, the volatility index, the VIX, stopped short of the closing high from the week. The 20.7% surge to close at 33.5 was still impressive. The iPath S&P 500 VIX ST Futures ETN (VXX) gained 23.7%. ProShares Ultra VIX Short-Term Futures (UVXY) gained 49.8%.
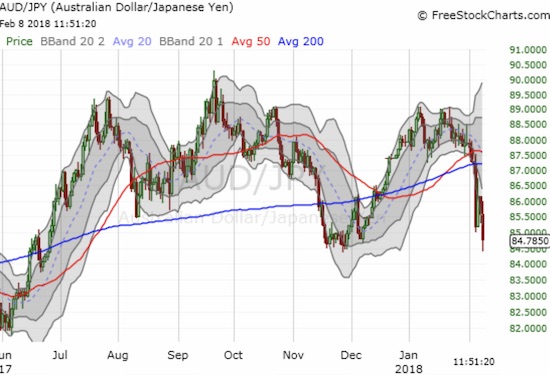
In the currency market, a strengthening Japanese yen (FXY) and a weakening Australian dollar (FXY) confirmed the negative sentiment. Combined, AUD/JPY, retested the lows from November. A break of those lows and follow-through would pretty much confirm for me that the stock market has topped out for the time-being (short to intermediate timeframe).
As awful as these technicals appear, they make the short-term trading decisions easier. With AT40 going oversold, I switched from neutral to cautiously bullish. The simple trade to make here is to fade a gap down at the open. Such a downward swoosh would greatly deepen oversold conditions, take the major indices to an unsustainable distance below their lower-BBs, perhaps drive the S&P 500 into uptrending 200DMA support, and create an unsustainable surge in volatility. Market makers take out stops and then fear finally exhausts itself. During past oversold episodes I have looked to a gap down to wash out the last of the weak hands and motivated sellers that paves the way for the eager bargain hunters. Yet, the market seems to rarely cooperate neatly with such diabolical plans. If the market does oblige, I will back up the truck on SPY call options and dig deeper into my shopping list of individual stocks.
I do not want a gap up on Friday. Such a move typically entices the selling at a higher point as the remaining motivated sellers look to sell what they were not able to sell in the previous panic. The simple trade for a gap up is simply to do nothing. In this scenario, I prefer to let buyers prove themselves by holding the close at or near the day’s highs alongside a lower VIX. I might even wait for oversold conditions to end.
I had these two main scenarios in mind as I executed a few trades on the day per my AT40 trading rules. For example, I accumulated more put options on UVXY expiring at the end of next week. What goes up big comes down big. This was the lesson on Tuesday when the last oversold period ended with UVXY gapping up near 30 and closing just above 15. Recall that day I cleared out all three of my UVXY put tranches with profits. I plan to continue the current cycle of put buying until the next implosion of volatility.
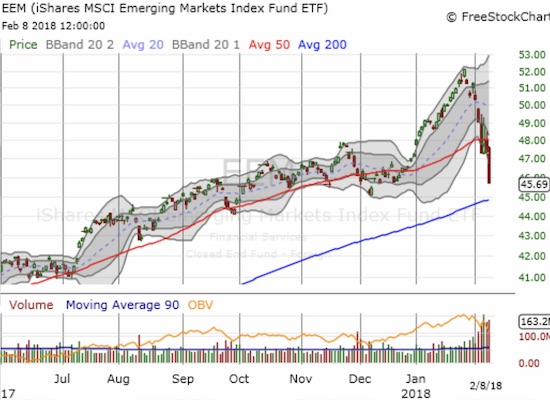
With selling accelerating into the close, I started my switch to reduce bearish positions and increase bullish positions. I took profits on my put options on Caterpillar (CAT). The stock ended the day with a 5.4% loss and confirmed a 50DMA breakdown. I did not close any shares sold short. I also held onto my March put options on BHP Billiton (BHP) and will take profits on a gap down Friday. Some more housing plays filled with a doubling down on Meritage Homes (MTH) shares and call options. I added an SPY call option and even reached for call options on iShares MSCI Emerging Markets ETF (EEM). EEM stretched well below its lower-Bollinger Band (BB) with a 3.5% loss. Support at its 200DMA already looms close.
My most interesting trade came on Apple (AAPL). AAPL started the day moving exactly opposite the market. AAPL had a high stakes fight with 200DMA support as it gapped up slightly and traded higher for a bit. Gravity eventually caught AAPL and sellers were just as ruthless to AAPL in the final 15 minutes as they were to the market at large. I set a limit order for a weekly call play for next week and grabbed a fistful of put options thinking AAPL had a lot more room for downside given the earlier stubbornness of buyers. Within minutes my put options doubled, and I locked in the profits per rule for quick profits. Those profits paid for the call options that triggered in the middle of the market’s accelerated selling. While AAPL is in bearish territory with another 200DMA breakdown and a topping pattern preceding this selling, I am betting that the stock has enough gas in the tank to at least mount one more defense of its 200DMA.
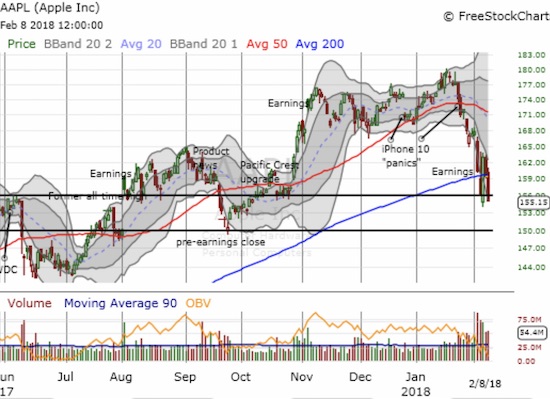
CHART REVIEWS
Twitter (TWTR)
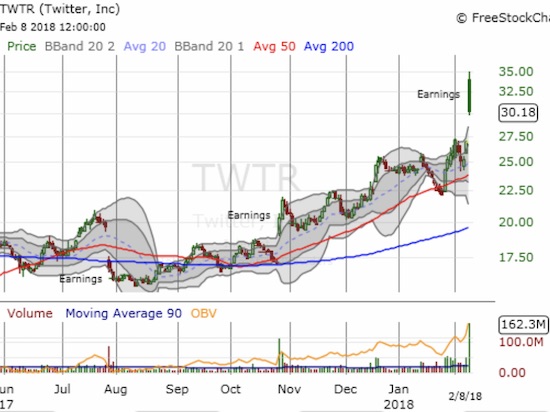
TWTR took the baton from Snap (SNAP) which put on an electrifying post-earnings show yesterday. TWTR gapped higher and at one point was trading with a 30.1% gain. TWTR ended the day with a 12.2% gain. I cannot finger short-covering bears on this one as the latest data show only 5.4% of TWTR’s float was sold short ahead of earnings.
Unlike SNAP, I was not patiently sitting on a position in TWTR. I took profits on my last position back in November, 2017. It did not even occur to me to make a new play on TWTR after it successfully tested 50DMA support at the end of January. I last wrote about TWTR in December, 2016 when I made the case for TWTR as a “Trump Trade.” From there TWTR rallied into 2017, but it struggled for most of the rest of the year. It bottomed in April near $14.
I did not want to chase TWTR here, so I made a very conservative trade by buying a calendar call spread at the $34 strike. The short end should easily expire on Friday and pay for half the long end. The net position will now only become profitable if TWTR manages a sharp turn-around from the deep fade off its post-earnings high.
First Solar (FSLR)
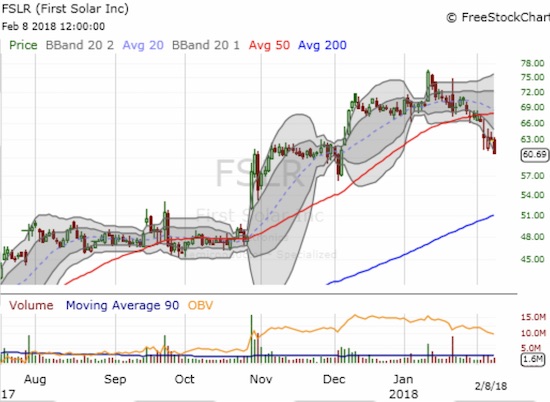
FSLR is symbolic of the euphoria that even started to infect me last month. I gushed when FSLR hit a major milestone by surging to a marginal 6+ year high. I did not expect FSLR to reach such heights for a long time to come. Not wanting to miss the follow-through to the breakout, I bought into the first pullback. FSLR has barely stopped selling since then! The stock is now working on a bearish 50DMA breakdown. A retest of the 200DMA seems far away now, but it is a very real possibility. I might start over with shares at that point.
— – —
FOLLOW Dr. Duru’s commentary on financial markets via email, StockTwits, Twitter, and even Instagram!
“Above the 40” uses the percentage of stocks trading above their respective 40-day moving averages (DMAs) to assess the technical health of the stock market and to identify extremes in market sentiment that are likely to reverse. Abbreviated as AT40, Above the 40 is an alternative label for “T2108” which was created by Worden. Learn more about T2108 on my T2108 Resource Page. AT200, or T2107, measures the percentage of stocks trading above their respective 200DMAs.
Active AT40 (T2108) periods: Day #1 under 20% (Day #1 oversold, ending 2 days over 20%), Day #4 under 30%, Day #5 under 40%, Day #5 under 50%, Day #6 under 60%, Day #12 under 70%
Daily AT40 (T2108)
")
Black line: AT40 (T2108) (% measured on the right)
Red line: Overbought threshold (70%); Blue line: Oversold threshold (20%)
Weekly AT40 (T2108)

*All charts created using freestockcharts.com unless otherwise stated
The charts above are my LATEST updates independent of the date of this given AT40 post. For my latest AT40 post click here.
Related links:
The AT40 (T2108) Resource Page
You can follow real-time T2108 commentary on twitter using the #T2108 or #AT40 hashtags. T2108-related trades and other trades are occasionally posted on twitter using the #120trade hashtag.
Be careful out there!
Full disclosure: long SNAP shares and short covered call, long SPY calls, long UVXY puts, long BHP puts, long TWTR calendar call spread, long EEM calls, long AAPL call, long FSLR calls
*Charting notes: FreeStockCharts.com uses midnight U.S. Eastern time as the close for currencies. Stock prices are not adjusted for dividends.
The wild volatility continues. The VIX was as high as 41, but closed down 13% from yesterday.
The market was up at the end, giving every indication just a couple hours before the close that it would yet again accelerate downward to another 2-3% loss.
Not what either of us wanted to see. Most of my buy orders never executed, as they were set too low, and then the market recovered. It still needs a further decline to really purge the speculators, and instill some wide ranging bearishness.
Hopefully we will get that, as I think a quick recovery from here would be very unhealthy. In the meantime, it will do everything possible to fool us. I’ll just stick to my plan.
Stick to the plan. I think we both have enough experience with these kinds of sell-offs to succeed. A quick recovery would indeed not be healthy. I also think that it is not likely. Still thinking through my next note!