
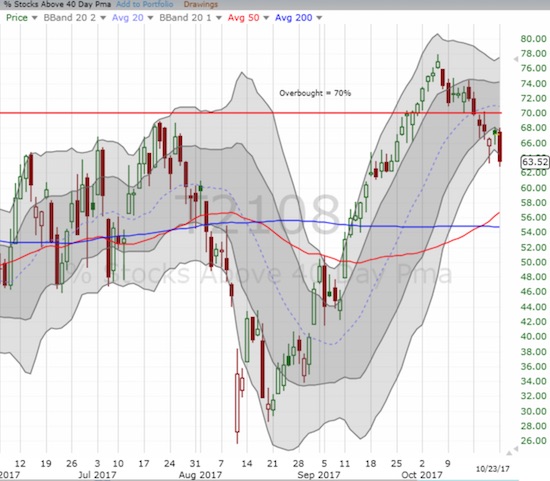
AT40 = 63.5% of stocks are trading above their respective 40-day moving averages (DMAs) – ended 12 straight days overbought
AT200 = 58.8% of stocks are trading above their respective 200DMAs
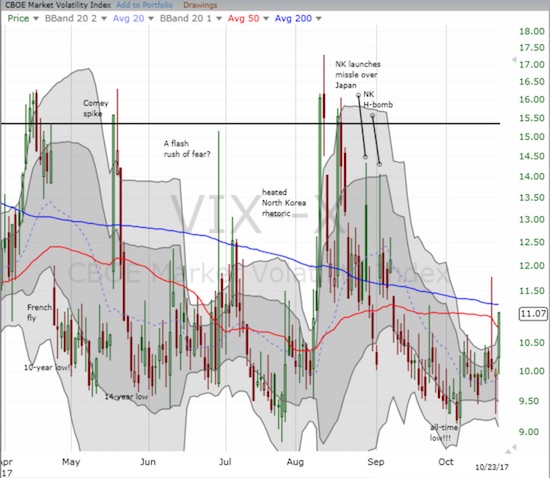
VIX = 11.1
Short-term Trading Call: cautiously bullish (downgrade from bullish)
Commentary
Just when I thought it was safe to stay bullish, the stock market took a notable turn southward.
The S&P 500 (SPY) lost just a fraction of a percent, but it was enough to reverse nearly the entire gain from Friday and produce a bearish engulfing pattern. In other words, the index flipped 180 form Friday’s bullish gap up and now wavers in the middle of a classic topping pattern.
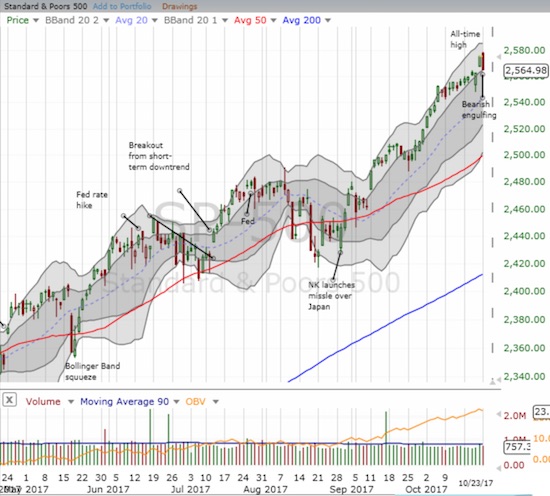
The NASDAQ and the PowerShares QQQ ETF (QQQ) both lost 0.6% as they each pulled away from an all-time high or a near all-time high.
Importantly, the volatility index, the VIX, put on a rare display of strength. The VIX gained 11.1% AND held its high of the day; the volatility faders actually failed to show up. This behavior suggests higher VIX levels are coming soon (like this week).
The icing on the cake is AT40 (T2108), the percentage of stocks trading above their respective 40DMAs. My favorite technical indicator closed at 63.5%, a 1 month low. This move essentially confirms last week’s fall from overbought status…a confirmation of a bearish event.
All this action forced me to downgrade my short-term trading call. I hate to churn my trading call so quickly – witness my reluctance to downgrade my call when the overbought period ended. So I only went to cautiously bullish instead of neutral or cautiously bearish; I am wary that I would have to turn right around and upgrade once the stock market’s seasonally strong period begins sometime in November.
The line in the sand on the S&P 500 is the intraday low from last week’s quick sell-down (on the 30th anniversary of the crash of 1987): 2,562. If the S&P 500 closes below that level AND follows through, I will skip right through neutral and go straight to cautiously bearish.
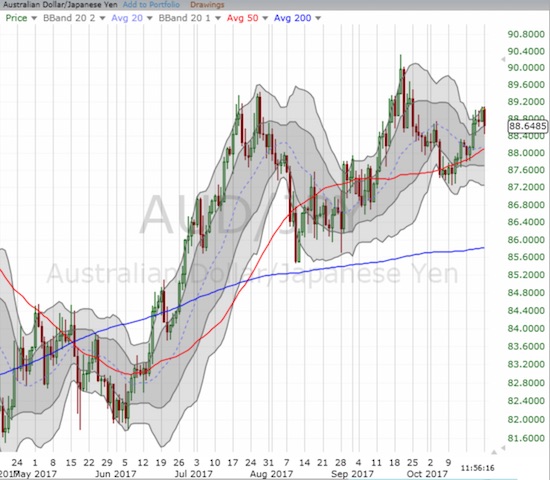
Note that the Australian dollar (FXA) versus the Japanese yen (FXY) is still not providing confirming information. AUD/JPY remains in a bullish position by trading above its uptrending 50DMA.
STOCK CHART REVIEWS
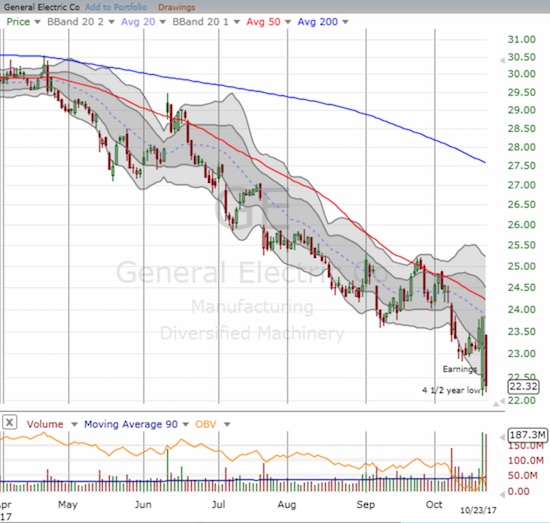
General Electric (GE)
Over the weekend, I almost wrote a piece about GE as an example of an easy bottom-fishing play. I am glad the clock ran out on me!
Analysts were busy cranking the numbers while I was dreaming about blog posts, and their conclusions were ugly. So many downgrades and negative commentary rained down on GE that buyers went into full-scale retreat. Friday’s impressive rebound gave way to a 6.3% loss. GE barely bounced off Friday’s open and trading volume was just as heavy as Friday’s. As a bottom-fishing play, GE was a hold until/unless the stock closed below Friday’s low intraday. Optimists can see this change in events as an opportunity for a very low risk bottom-fishing play. Pessimists might salivate in anticipation of a major shorting opportunity. Regardless, GE now teeters on the edge of a resumption of the downtrend that has plagued the stock all year. Maybe 2018 will be the year for GE as a “dog of the Dow“?
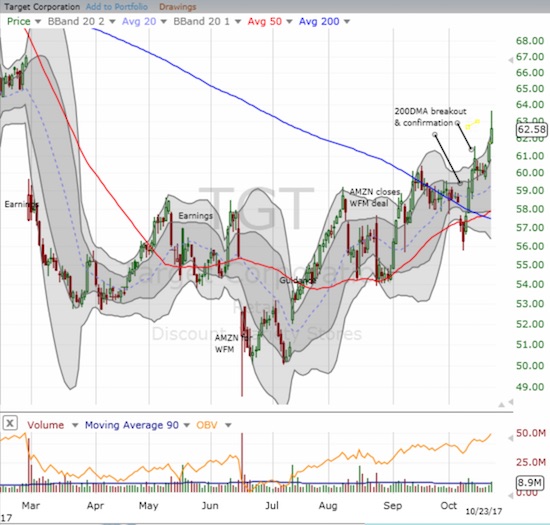
Target (TGT)
A true recovery continues with Target. Today’s 1.3% gain not only delivered impressive relative strength but also it printed a further confirmation of the stock’s 200DMA breakout. I did not buy a fresh round of call options on TGT on the breakout, but I am still holding onto my shares. Earnings are on November 15th. If upward momentum continues, I am hope I will have enough cushion to give me confidence to hold through earnings.
— – —
FOLLOW Dr. Duru’s commentary on financial markets via email, StockTwits, Twitter, and even Instagram!
“Above the 40” uses the percentage of stocks trading above their respective 40-day moving averages (DMAs) to assess the technical health of the stock market and to identify extremes in market sentiment that are likely to reverse. Abbreviated as AT40, Above the 40 is an alternative label for “T2108” which was created by Worden. Learn more about T2108 on my T2108 Resource Page. AT200, or T2107, measures the percentage of stocks trading above their respective 200DMAs.
Active AT40 (T2108) periods: Day #418 over 20%, Day #232 over 30%, Day #32 over 40%, Day #31 over 50%, Day #27 over 60%, Day #6 under 70%
Daily AT40 (T2108)
")
Black line: AT40 (T2108) (% measured on the right)
Red line: Overbought threshold (70%); Blue line: Oversold threshold (20%)
Weekly AT40 (T2108)

*All charts created using freestockcharts.com unless otherwise stated
The charts above are my LATEST updates independent of the date of this given AT40 post. For my latest AT40 post click here.
Related links:
The T2108 Resource Page
You can follow real-time T2108 commentary on twitter using the #T2108 or #AT40 hashtags. T2108-related trades and other trades are occasionally posted on twitter using the #120trade hashtag.
Be careful out there!
Full disclosure: long UVXY call options, long TGT, short AUD/JPY
*Charting notes: FreeStockCharts.com uses midnight U.S. Eastern time as the close for currencies. Stock prices are not adjusted for dividends.