
AT40 Status: 63.5% of stocks are trading above their respective 40-day moving averages (DMAs)
AT200 Status: 70.8% of stocks are trading above their respective 200DMAs
VIX Status: 12.1 (volatility index)
Short-term Trading Call: neutral
Commentary
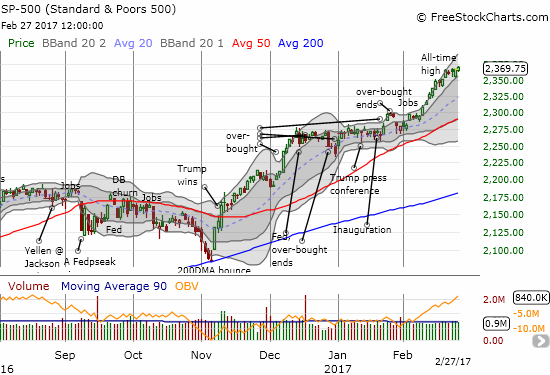
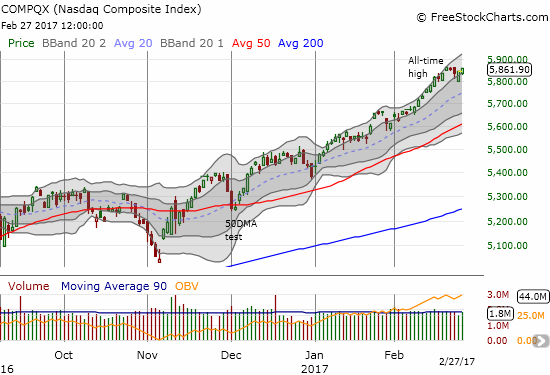
In my last “Above the 40” post, I noted that the rejection of AT40 (T2108), the percentage of stocks trading above their respective 40-day moving averages (DMAs), from overbought status is typically a bearish signal. I avoided making the switch in my trading call because of the on-going strength of price action. Sure enough, as AT40 languished for 2 more days, the S&P 500 (SPY) managed to fight off selling pressure to close with marginal gains. On Monday, February 27th, AT40 increased to 63.5% as the S&P 500 made a new (marginal) all-time high. The index now sits in coiled anticipation of the next potential catalyst: President Trump’s address to a joint session of Congress. The S&P 500 has a fresh ladder to climb all the way to its topmost upper-Bollinger Band (BB).
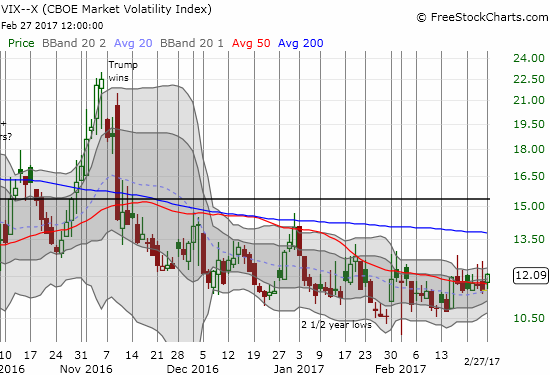
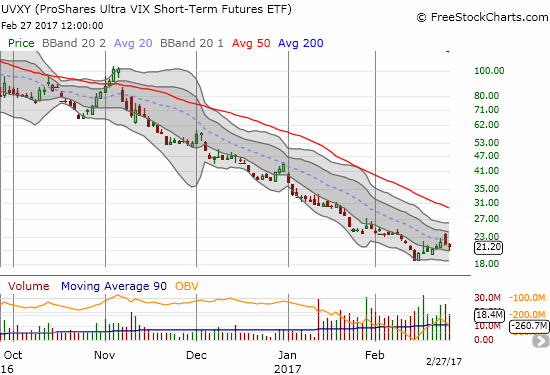
The irony of Monday’s more solidly bullish day was that the volatility index also showed a modicum of strength. For much of the day, my decision to double and then triple down on my puts on ProShares Ultra VIX Short-Term Futures (UVXY) looked great with the position turning green. Yet, in the last 90 minutes of the trading day, the volatility index, the VIX, suddenly surged higher to close with a 5.4% gain. UVXY still lost 1.1%. I now look to Wednesday morning when I expect a fresh implosion of volatility in response to the end of uncertainty about President Trump’s address to Congress.
As the VIX churns away, drama has swelled in several individual stocks that I am watching and/or trading closely.
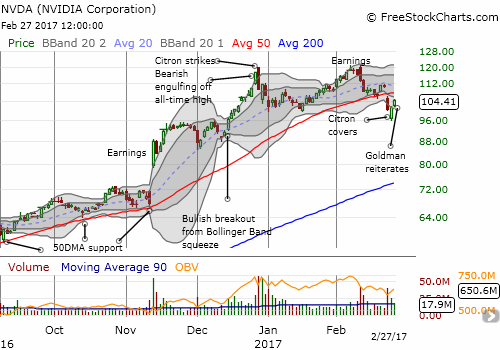
NVIDIA (NVDA)
Just when I thought NVIDIA was “done,” two key actions came to the rescue. First, short-seller Citron announced on Friday that it had covered its short position in NVDA. This was an important announcement because Citron was able to knock NVDA off its perch and all-time highs by announcing its short. NVDA quickly went from a very bearish gap down below its lower-BB to a close just above the psychologically important $100 level. On Monday, NVDA buyers went right back to work and printed a 2.9% gain on the heels of another bullish call from Goldman Sachs (GS). GS reiterated its “conviction buy list” and a $130 price target. Another close above 50DMA resistance should all but seal the deal for buyers and bulls.
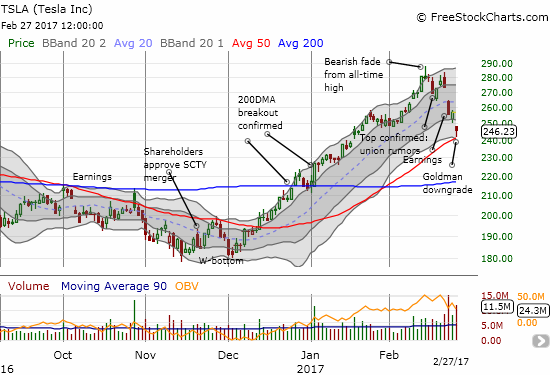
Tesla (TSLA)
Technicals won again.
On February 16th, I wrote a post titled “Toppy Tesla.” I made a mostly technical argument that appeared confirmed by the selling in response to union activity at the TSLA plant. A post-earnings sell-off further underlined the topping pattern. I was supposed to hold my short until a test of 50DMA support, but I instead covered on the first day following earnings. A Goldman Sachs downgrade to sell and a price target cut from $190 to $185 pushed TSLA right to support before buyers stepped in for the obligatory defense of 50DMA support. TSLA ended the trading day with a hammer pattern and a potential bottom that just awaits confirmation. Buyers can confirm a successful test of support by starting out the gate strong Tuesday morning and then closing TSLA with a gain. A close above the lower-BB would instill yet more confidence. Note well that the 20DMA (dashed blue line) is starting to turn downward along with the lower-BBs.
Caterpillar (CAT)
Recently, the Trump infrastructure trade has become very volatile. On Thursday, word flared across Wall Street that the administration would postpone infrastructure plans until 2018 to give time for other legislative priorities. Infrastructure-related stocks took a dive. CAT dropped a whopping 2.7%. The move looked particularly bearish for CAT as the sell-off left behind what looks like a double top. The selling continued on Friday. CAT broke down below 50DMA support, but buyers managed to push CAT back to a complete recovery by the close. Monday, CAT jumped 2.1% as Trump insisted he will make a big announcement on infrastructure the following day. Given the estimated $1 trillion estimate for Trump’s plan, I cannot imagine how the real plan could turn out even bigger and bolder. It is a situation set up for selling on the news, but we will see…
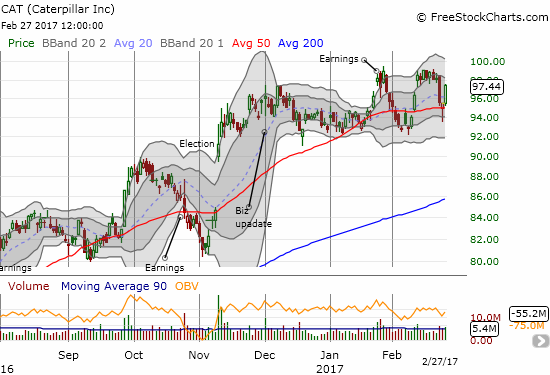
I returned to bearishness on CAT in early February. At the time, I held off on going short until sellers provided additional confirmation with a breakdown below $91.50, a level that defined support from the last two months. My caution paid off as CAT soon proceeded to bounce sharply. The infrastructure-related sell-off encouraged me to throw some of that caution to the wind, especially as I am now looking a little more actively to hedge bullish positions. I accumulated a handful of put options into Friday’s selling. If CAT fails to close above its double-top in response to Trump’s announcement on infrastructure, I will double down on my put options. (Click here for my recent perspective on Trump Trades). A breakout above that double-top and the $100 level would of course be very bullish.
I end with the following 2-minute snippet of an interview with former Treasury Secretary Larry Sumners who is now a professor of Harvard’s Kennedy School of Government. Sumners worries about a “sugar high” in the market. More importantly, he made an interesting historical observation on stock market performance in the first two months of a new presidency: Bill Clinton and Barack Obama had the worst stock performances and Herbert Hoover had the best. These performances turned out to be inversely correlated to the subsequent performance in the economy. Gulp!
— – —
FOLLOW Dr. Duru’s commentary on financial markets via email, StockTwits, Twitter, and even Instagram!
“Above the 40” uses the percentage of stocks trading above their respective 40-day moving averages (DMAs) to assess the technical health of the stock market and to identify extremes in market sentiment that are likely to reverse. Abbreviated as AT40, Above the 40 is an alternative label for “T2108” which was created by Worden. Learn more about T2108 on my T2108 Resource Page. AT200, or T2107, measures the percentage of stocks trading above their respective 200DMAs.
Active AT40 (T2108) periods: Day #257 over 20%, Day #77 over 30%, Day #76 over 40%, Day #74 over 50%, Day #16 over 60% (overperiod), Day #23 under 70% (underperiod)
Daily AT40 (T2108)
")
Black line: AT40 (T2108) (% measured on the right)
Red line: Overbought threshold (70%); Blue line: Oversold threshold (20%)
Weekly AT40 (T2108)

*All charts created using freestockcharts.com unless otherwise stated
The charts above are my LATEST updates independent of the date of this given AT40 post. For my latest AT40 post click here.
Related links:
The T2108 Resource Page
You can follow real-time T2108 commentary on twitter using the #T2108 or #AT40 hashtags. T2108-related trades and other trades are occasionally posted on twitter using the #120trade hashtag.
Be careful out there!
Full disclosure: long UVXY put options, long NVDA, long NVDA call and put spreads