
AT40 Status: 65.6% of stocks are trading above their respective 40-day moving averages (DMAs)
AT200 Status: 70.2% of stocks are trading above their respective 200DMAs
VIX Status: 11.7 (volatility index)
Short-term Trading Call: neutral
Commentary
The struggle for the overbought threshold continues.
AT40 (T2108), the percentage of stocks trading above their respective 40-day moving averages (DMAs), closed at 65.6% a day after scraping the overbought threshold (70%) with a close at 69.3%. Normally, I would interpret this failure as a bearish warning flag – an indication that buyers are running out steam. However, the persistent buying in the market has me looking for an “accumulation” of evidence before switching from my neutral trading call (I still have no expectations for switching to bullish from here). Indeed, as AT40 printed a definitive failure at the overbought threshold, the S&P 500 barely budged with a 0.1% loss on the day.
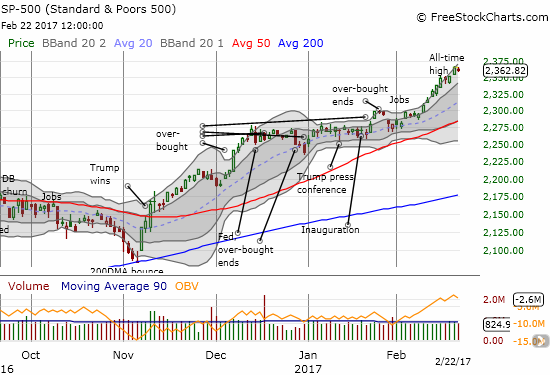
A bearish confirmation would not occur until the S&P 500 reversed all its post-breakout gains and closed below 2300. Such a move is a 2.6% pullback away.
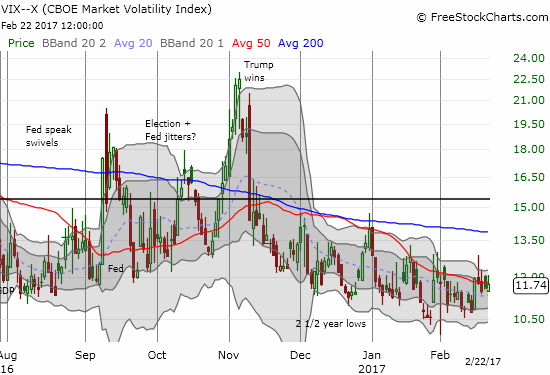
The volatility index, the VIX, seems content for now to hover above 11. This period of extremely low volatility is working out just as history predicts: extremely low volatility can last for an extended period of time…without leading to a large sell-off right after volatility finally starts to rise again. Given this history, I finally pulled the trigger on a fresh batch of short-term put options on ProShares Ultra VIX Short-Term Futures (UVXY).
While volatility is mostly a bore, there is plenty of excitement with individual stocks.
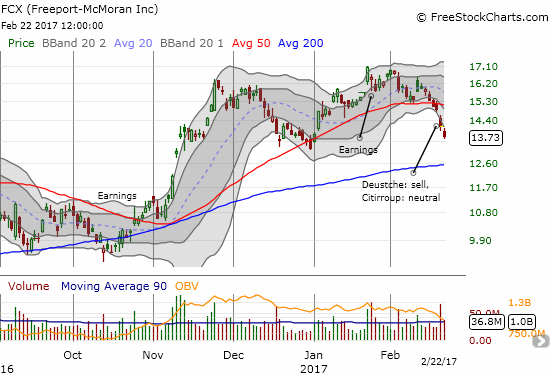
Freeport-McMoran (FCX) has suddenly went from bullish to bearish. Analysts helped knock FCX through support at its 50DMA. Given the high selling volume and follow-through on post-earnings weakness, I strongly suspect a retest of 200DMA support is not far away.
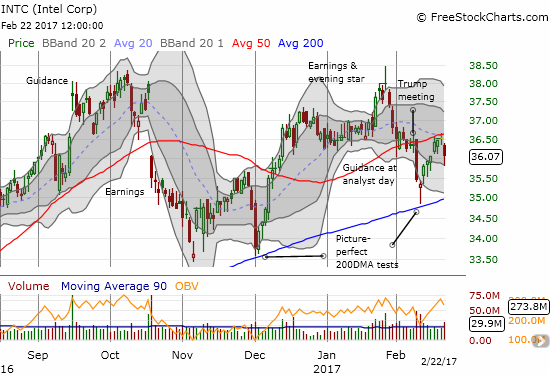
Intel (INTC) is trying to move in the opposite direction. The stock spent three days trying to break through resistance at its 50DMA. Alas, to no avail. On Wednesday, INTC fell from resistance for a 1.2% loss. Given the loss from guidance provided at analyst day was completely reversed before this pullback, I am still holding out for an eventual breakout.
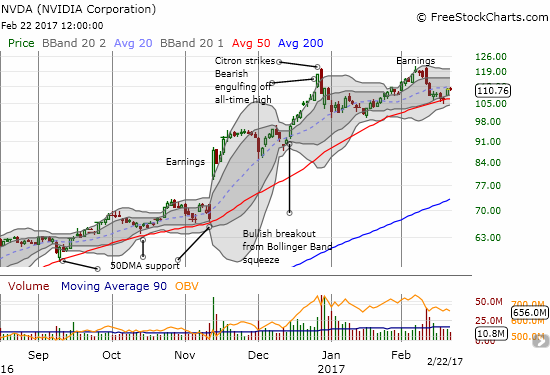
NVIDIA Corporation (NVDA) is putting up a good fight at its 50DMA support. The bearish engulfing pattern from earnings gave NVDA the look of a double-top (and a double bearish engulfing on top of that!). The apparently successful test of the 50DMA at support now increases the odds that buyers will soon find enough momentum to invalidate the double-top. This development will be important to watch especially given NVDA’s status as a tech market darling.
In case you are interested in the latest bear case, here is one from Gluskin Sheff’s David Rosenberg, quoted in Yahoo Finance…
- Consensus Inc. Bullish Sentiment: 75%
- NYSE Put/Call Ratio: 0.80x
- CBOE’s equity volatility index (VIX): 11.5x — The S&P’s 65-dat rolling volatility is at a record low (this typically occurs ahead of a corrective phase)
- Market Vane Bullish Sentiment: 68%
- Forward P/E multiple: 18x; and the trailing is at 21x — in the top quintile of historical valuations
- Investors Intelligence Sentiment: 61.8% bulls; 17.6% bears
- The 14-day relative strength index has moved to 77.4, above the 70 level widely viewed as being an “overbought” threshold
- The S&P 500 has now gapped up nearly 8% above its 200 day moving average, another sign of an overextended stock market.
- Earnings expectations have significantly lagged market price action — in fact, according to S&P Capital IQ data, analyst EPS projections for 2017 have actually dipped a little to $130.31 from $131.02 three months ago.
- The S&P 500 has already climbed above year-end targets for well over half of the Wall Street strategists out there.
— – —
FOLLOW Dr. Duru’s commentary on financial markets via email, StockTwits, Twitter, and even Instagram!
“Above the 40” uses the percentage of stocks trading above their respective 40-day moving averages (DMAs) to assess the technical health of the stock market and to identify extremes in market sentiment that are likely to reverse. Abbreviated as AT40, Above the 40 is an alternative label for “T2108” which was created by Worden. Learn more about T2108 on my T2108 Resource Page. AT200, or T2107, measures the percentage of stocks trading above their respective 200DMAs.
Active AT40 (T2108) periods: Day #254 over 20%, Day #74 over 30%, Day #73 over 40%, Day #71 over 50%, Day #13 over 60% (overperiod), Day #20 under 70% (underperiod)
Daily AT40 (T2108)
")
Black line: AT40 (T2108) (% measured on the right)
Red line: Overbought threshold (70%); Blue line: Oversold threshold (20%)
Weekly AT40 (T2108)

*All charts created using freestockcharts.com unless otherwise stated
The charts above are my LATEST updates independent of the date of this given AT40 post. For my latest AT40 post click here.
Related links:
The T2108 Resource Page
You can follow real-time T2108 commentary on twitter using the #T2108 or #AT40 hashtags. T2108-related trades and other trades are occasionally posted on twitter using the #120trade hashtag.
Be careful out there!
Full disclosure: long UVXY put options, long NVDA, long FCX, long INTC call options, long NVDA call and put spreads