
(T2108 measures the percentage of stocks trading above their respective 40-day moving averages [DMAs]. It helps to identify extremes in market sentiment that are likely to reverse. To learn more about it, see my T2108 Resource Page. You can follow real-time T2108 commentary on twitter using the #T2108 hashtag. T2108-related trades and other trades are occasionally posted on twitter using the #120trade hashtag. T2107 measures the percentage of stocks trading above their respective 200DMAs)
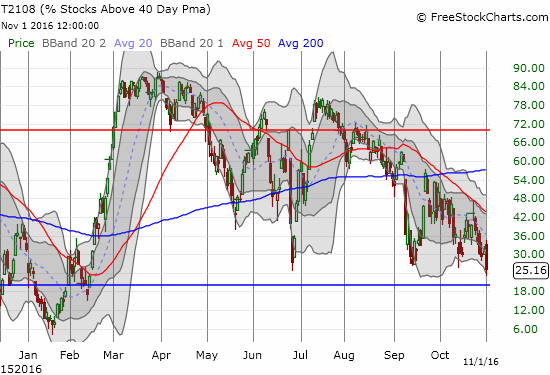
T2108 Status: 25.2% (as low as 22.9%)
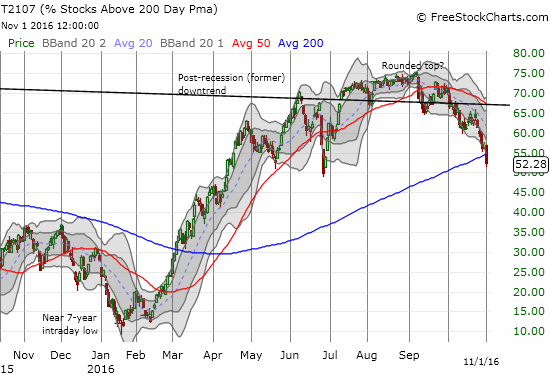
T2107 Status: 52.3%
VIX Status: 18.6 (an 8.8% gain, the VIX was as high as 20.4)
General (Short-term) Trading Call: neutral (see caveats below)
Active T2108 periods: Day #177 over 20%, Day #3 under 30% (underperiod), Day #8 under 40%, Day #25 under 50%, Day #40 under 60%, Day #66 under 70%
Commentary
In my last T2108 Update, I described Friday’s rush to sell stocks in the wake of political headlines as overdone and an opportunity to fade volatility. I made this claim even while acknowledging that growing divergences in the stock market significantly raised the odds of an imminent tumble toward or into oversold territory for the stock market. I was also a little hesitant to execute the fade because the volatility index, the VIX, had just popped over the 15.35 pivot and positioned itself to launch even higher. Sure enough, the VIX has gained two more days for a total of 6 straight days. The VIX is up 42.5% since the Monday of last week. At today’s intraday high, the VIX had gained 56.9%.
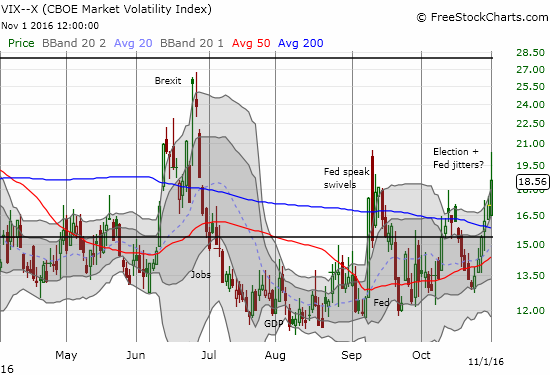
As a reminder, a VIX of 20 is conventionally considered “high.” September’s burst of volatility could only produce an above 20 reading for part of the day. Brexit trading swivled around 20 before completely imploding. With T2108 – the percentage of stocks trading above their respective 40-day moving averages (DMAs) – tumbling toward oversold levels, I went back to work fading volatility.
%stocks > 40DMA ~ 26%. Approaching oversold (20%). Close here would be lowest since Feb. Post-Brexit intraday low was 24.5%. #T2108 $SPY
— Dr. Duru (@DrDuru) November 1, 2016
%stocks > 40DMA got as low as 23%. Level not seen since Feb sell-off. #VIX spike may make this "close enuff" to oversold (20%) #T2108 $SPY
— Dr. Duru (@DrDuru) November 1, 2016
While the volatility spike is enticing to fade in of itself, I am mainly fading right now because of Wednesday’s pronouncement from the Fed on monetary policy. The Fed is typically careful to avoid generating volatility and even moreso when the market is hot and bothered going into the announcement. When I faded volatility on Friday, I completely neglected to take into account the potential for volatility to continue rising right into the Fed announcement. With the U.S. Presidential election now around the corner, I will be VERY quick to take any profits I get from a post-Fed volatility implosion. And let’s not forget the U.S. jobs report in between (on Friday, November 4th)!
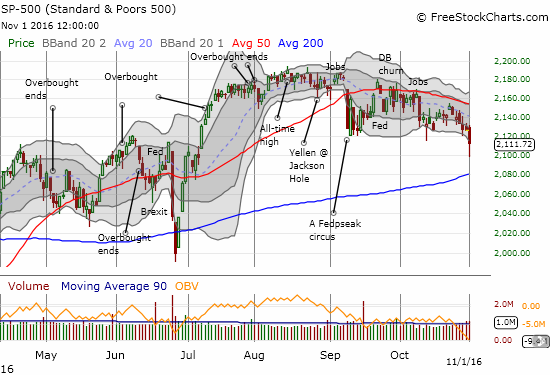
The S&P 500 (SPY) took a strong whack on a relative basis. While the index closed with a marginal 0.7% loss, it broke down to a new 4-month low. The intraday low even hit the psycholigcally important 2100 level. This new low confirms 50DMA resistance. The 50 and 20DMAs are firmly entrenched as downtrend lines. Flipping call options on SPY was interesting at this juncture – indeed very enticing with the dip well below the lower-Bollinger Band (BB). Yet, I decided to hold off at least one more day. Hopefully, T2108 will dip into official oversold territory before I buy.
While signs of technical damage abound, a glaring sign of trouble comes from T2107, the percentage of stocks trading above their respective 200DMAs. T2107 fell to 52.3%. T2107 has not closed this low since day #1 of post-Brexit trading and is thus close to providing complete confirmation of a market top.
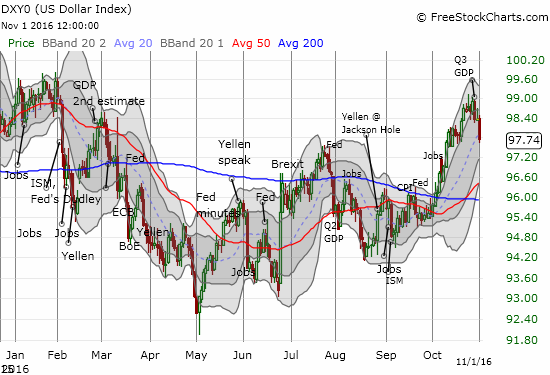
While much of the stock market was busy selling off, commodity-related stocks were busy rallying. Presumably, a tumbling U.S. dollar index (DXY0) was a main driver. This sell-off SEEMS like the market’s attempt to get ahead of a “sell the news” move after the Fed (presumably) confirms it is on track to hike rates in December. The dollar rally going into this week was supposedly all about the prospect of rising rates.
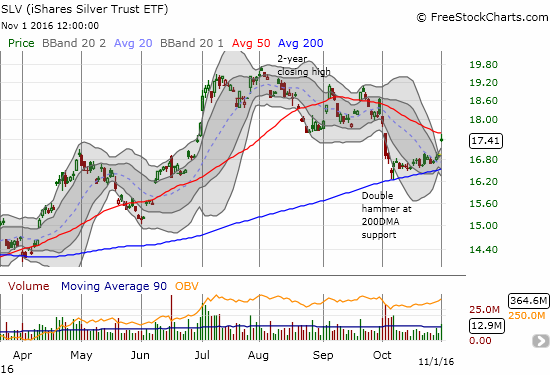
Precious metals were some of the bigger beneficiaries of the dollar’s loss. Most importantly for my trading idea of a bottom for gold and silver, iShares Silver Trust (SLV) finally broke away from 200DMA support and gapped higher to a 2.6% gain. With my fist full of call options expiring on Friday (purposely timed for post-Fed) and SLV butting heads with 50DMA resistance, I locked in my profits.
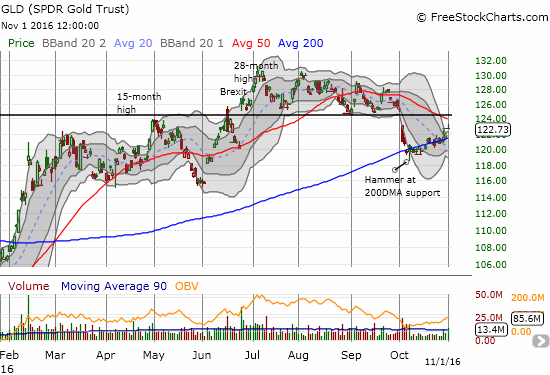
Gold continued to lag silver. The SPDR Gold Shares (GLD) gapped up for a mere 0.7% gain. GLD still has room to run to hit 50DMA resistance.
The technical picture could change dramatically after the Fed delivers its latest salves for the market, so I am not posting a bunch of new charts here. I do have three quick trading updates from my last T2108 Update. Please refer to that post for a complete set of my latest tradeable charts.
On Monday, Netflix (NFLX) broke down from its recent consolidation. I immediately initiated my typical two-way trade with call and put options. The net remains flat. I targeted Friday expiration this time given the potential swirl this week. The typical trade horizon for the NFLX trade is 2 to 3 expirations out.
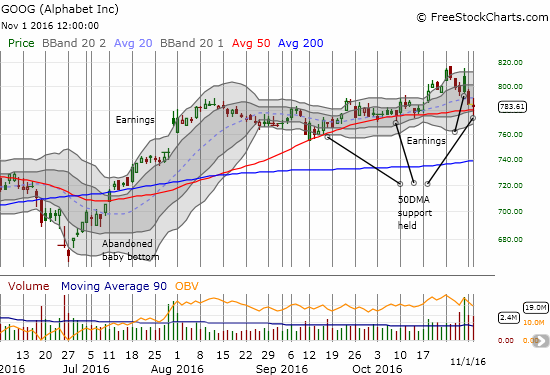
In my last T2108 Update, I noted that Alphabet’s (GOOG) post-earnings gap and crap put 50DMA support into play. Just two days later, GOOG tested that support…and succeeded. I was ready with a low ball offer on a call option that filled upon GOOG breaking 50DMA support. I decided to lock in my small profit on the eventual bounce rather than hold through the Fed. GOOG remains on my list whether to play confirmed support at the 50DMA or a confirmed breakdown.
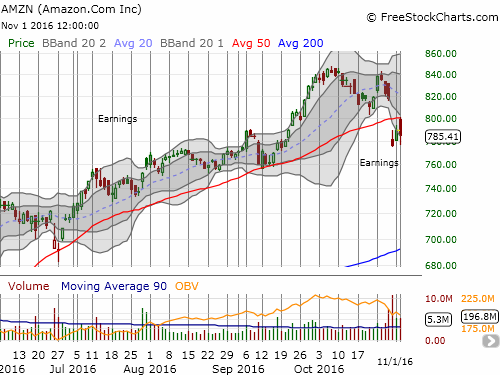
Amazon.com (AMZN) hit my $800 target very quickly. Since I bought a call spread that does not expire until next week, I was not ready/willing to lock in profits just yet. By the close, AMZN had faded so hard from 50DMA resistance that it ALMOST touched its post-earnings low before bouncing back to a fractional loss. Playing 50DMA resisatnce somehow never even crossed my mind…
— – —
FOLLOW Dr. Duru’s commentary on financial markets via email, StockTwits, Twitter, and even Instagram!
Daily T2108 vs the S&P 500
")
Black line: T2108 (measured on the right); Green line: S&P 500 (for comparative purposes)
Red line: T2108 Overbought (70%); Blue line: T2108 Oversold (20%)
Weekly T2108

*All charts created using freestockcharts.com unless otherwise stated
The charts above are the my LATEST updates independent of the date of this given T2108 post. For my latest T2108 post click here.
Related links:
The T2108 Resource Page
Be careful out there!
Full disclosure: long SDS, long UVXY shares and short UVXY call and long UVXY put options, net long the U.S. dollar index, long GLD, long SLV shares, long AMZN call spread, long NFLX call and put options
In the possible, but unlikely, scenario where Trump wins, it could send T2108 to levels last seen at the beginning of the year. Maybe lower!
It’s quite fashionable to hate Trump, so I would expect the market’s reaction would be very negative, should he miraculously manage to prevail.
The silver lining, of course, is that it would create quite an opportunity for those of us who are long term investors (yes, there are still a few of us left). My best long term results have come from buying conservative stocks when the market nosedived. I’m hoping for another opportunity for that to happen, and I will be loading up if it does.
In the long run, the market doesn’t care who the president is….or was…..
I fully agree – in the long-term, the selection of the President matters little. The American economy has a way of chugging along and adapting. From a technical perspective, I don’t care much about the trigger of the oversold conditions, only the behavior of the VIX and tests of important resistance/support on the major indices.