
(T2108 measures the percentage of stocks trading above their respective 40-day moving averages [DMAs]. It helps to identify extremes in market sentiment that are likely to reverse. To learn more about it, see my T2108 Resource Page. You can follow real-time T2108 commentary on twitter using the #T2108 hashtag. T2108-related trades and other trades are occasionally posted on twitter using the #120trade hashtag. T2107 measures the percentage of stocks trading above their respective 200DMAs)
T2108 Status: 81.4%
T2107 Status: 62.8% (highest since September, 2014)
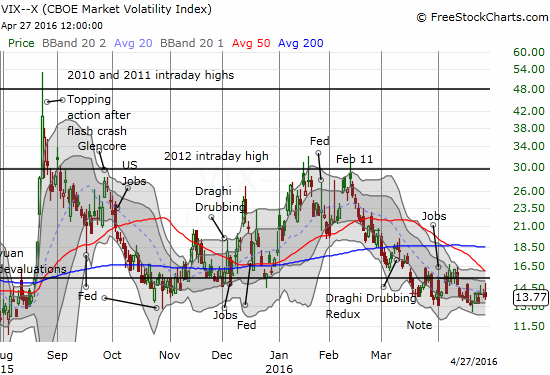
VIX Status: 13.8
General (Short-term) Trading Call: cautiously bullish
Active T2108 periods: Day #53 over 20%, Day #52 over 30%, Day #49 over 40%, Day #46 over 50%, Day #42 over 60%, Day #41 over 70% (overbought), Day #11 over 80%
Commentary
T2107, the percentage of stocks trading above their respective 200-day moving averages (DMAs), continues to expand and show off the underlying strength of the stock market. This technical indicator is at heights last seen in September, 2014.
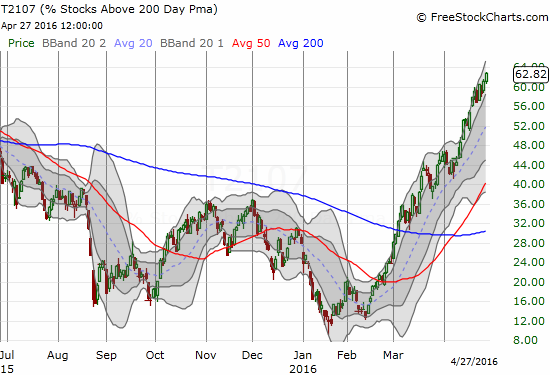
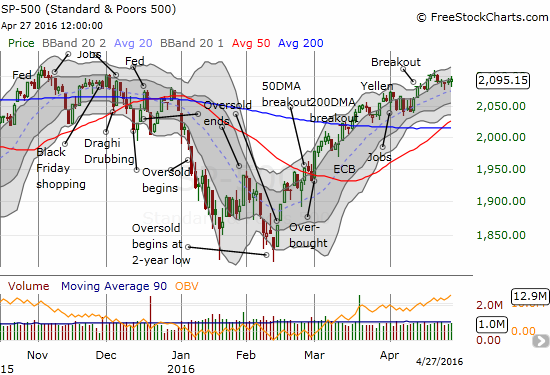
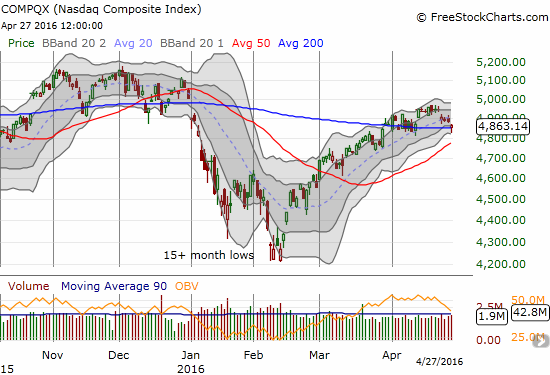
This expansion for T2107 is happening even as the S&P 500 (SPY) has stalled out over the past week. The NASDAQ (QQQ) has even traded DOWN over this time period as several marquee big cap tech stocks have sold off. The apparent divergence between T2107 and the major indices is bullish – it indicates a breadth of participation.
T2108 closed at 81.4%. While it is still off its high for the extended overbought period, my favorite technical indicator has increased 3 of the last 4 days. As I have said through most of this overbought period, T2108 above 80% is less relevant than T2107 which still has room to expand.
The volatility index has not signaled much as it continues to churn under the 15.35 pivot. Volatility never increased enough ahead of today’s Federal Reserve statement on monetary policy to trigger a trade to fade volatility. However, Apple’s gap down did help run-up volatility from the open until the Fed. More on Apple later.
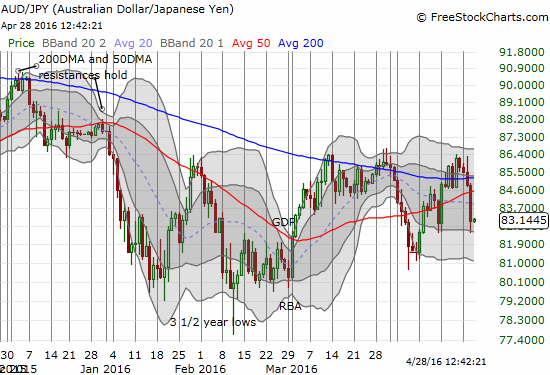
Speaking of central banks, the market’s reaction to the Bank of Japan’s (BoJ) statement on monetary policy throws an interesting twist on the outlook. The BoJ failed to provide more stimulus and traders immediately rushed right back into the Japanese yen (FXY). I discussed my opinions on the yen in “Forex Critical: Trader Confidence Continues to Grow.” I used the yen’s surge to close out my short on the Australian dollar (FXA) versus the yen. AUD/JPY is right back to bearish territory even as the stock market looks fine. I will not worry about any implications for the latest breakdown in AUD/JPY until/unless it breaks below April’s low.
In trading this week, I took profits on my put options on Netflix (NFLX). I executed a similar post-earnings trade on Google (GOOG) playing off a 50DMA breakdown. However, GOOG has the advantage of 200DMA support. It held like a champ today. I decided to hold since my put spread expires next week.
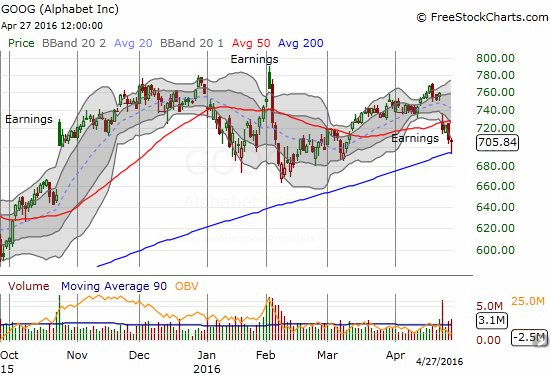
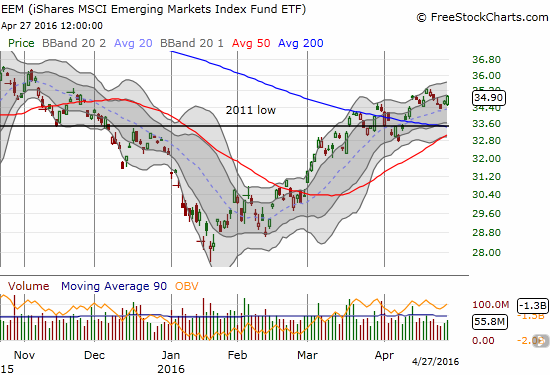
The stock continues to confirm its post-earnings 50DMA breakdown. I continued to accumulated call options in iShares MSCI Emerging Markets (EEM) in a change of strategy from my typical hedged approach. The pay-off may finally be coming as EEM bounced off support at its 20DMA.
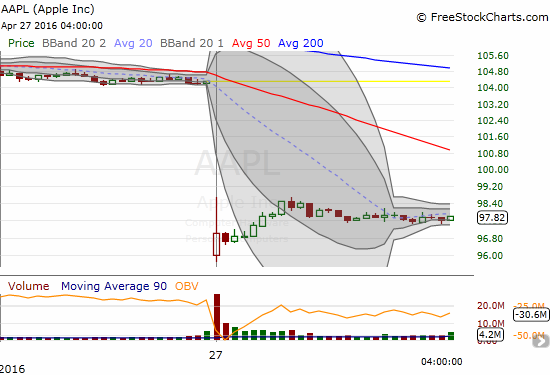
The big kahuna of the day was of course Apple (AAPL).
I wrote about my pre-earnings trade for AAPL in “Betting On Apple Earnings As the Stock Struggles to Hold Support.” Although I went into earnings bullish, the trade configuration ended up with profits on the puts that paid for the complete loss on the call spread. Apple’s gap down of around 8% and closing loss of 6.3% was truly epic for recent post-earnings history. Since 2007 and excluding today, AAPL was a healthy 7 up and 2 down for April earnings. Only 4 other post-earnings reactions since 2007 produced losses of 6% or greater. So, given the extreme nature of the after-market response, it made sense that market makers gapped AAPL down at the open as far as possible.
The chart below shows that buyers took over almost right from the open. AAPL had gapped down far below its lower-Bollinger Band (BB) which set up a reversal from over-extended trading conditions. This setup is one of my favorite reversal trades. I abstained from trying the trade because I could not make the mental switch fast enough from selling the puts to buying more AAPL on the long side.
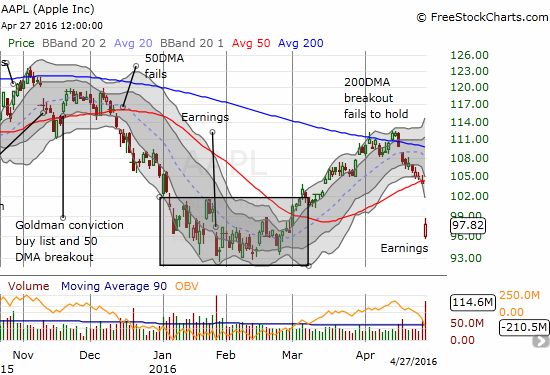
Going forward, AAPL is an even MORE interesting trade. Apple expanded the existing buyback program by $50B to a whopping grand total of $250B to be spent by the end of March, 2018. I assume this means AAPL will aggressively buy into this dip. I will trigger my next buy only after AAPL makes a new post-earnings high; presumably, such a milestone will demonstrate buying power. Even if AAPL breaks to a new post-earnings low from here, I will not go short: 1) the stock will become even more over-extended, 2) I am guessing such a continuation of selling will encourage AAPL to get particularly aggressive in its buying. Stay tuned!
No charts for these last trade updates:
- Disney (DIS) broke 200DMA resistance and became the latest stock to push T2107 higher.
- Alcoa (AA) gained 6.1% for a new post-earnings high that further confirms a bullish post-earnings push. I somehow missed buying the first post-earnings dip last week.
- U.S. Steel (X) recovered from a post-earnings gap down and retest of the 2009 intrady low to finish flat. X is a buy again on a new post-earnings high.
- THe run-up in Helix Energy Solutions Group (HLX) continues and has easily confirmed the 200DMA breakout
— – —
For readers interested in reviewing my trading rules for an oversold T2108, please see my post in the wake of the August Angst, “How To Profit From An EPIC Oversold Period“, and/or review my T2108 Resource Page.
Reference Charts (click for view of last 6 months from Stockcharts.com):
S&P 500 or SPY
U.S. Dollar Index (U.S. dollar)
EEM (iShares MSCI Emerging Markets)
VIX (volatility index)
VXX (iPath S&P 500 VIX Short-Term Futures ETN)
EWG (iShares MSCI Germany Index Fund)
CAT (Caterpillar).
IBB (iShares Nasdaq Biotechnology).
(Reload page and/or click on the image, if it is not correct. At time of writing, server is having cache issues)
Daily T2108 vs the S&P 500
")
Black line: T2108 (measured on the right); Green line: S&P 500 (for comparative purposes)
Red line: T2108 Overbought (70%); Blue line: T2108 Oversold (20%)
Weekly T2108

*All charts created using freestockcharts.com unless otherwise stated
The charts above are the my LATEST updates independent of the date of this given T2108 post. For my latest T2108 post click here.
Related links:
The T2108 Resource Page
Expanded daily chart of T2108 versus the S&P 500
Expanded weekly chart of T2108
Be careful out there!
Full disclosure: long DIS call options, long EEM call options, long GOOG put spread, long HLX shares