
(T2108 measures the percentage of stocks trading above their respective 40-day moving averages [DMAs]. It helps to identify extremes in market sentiment that are likely to reverse. To learn more about it, see my T2108 Resource Page. You can follow real-time T2108 commentary on twitter using the #T2108 hashtag. T2108-related trades and other trades are occasionally posted on twitter using the #120trade hashtag. T2107 measures the percentage of stocks trading above their respective 200DMAs)
T2108 Status: 81.6%
T2107 Status: 39.3%
VIX Status: 14.9
General (Short-term) Trading Call: cautiously bullish
Active T2108 periods: Day #29 over 20%, Day #28 over 30%, Day #25 over 40%, Day #22 over 50%, Day #18 over 60%, Day #17 over 70%, Day #15 over 80% (overbought)
Commentary
The market momentum I described in the last T2108 Update titled “A Different Kind of Breakout” has clearly wound down a bit. No one should be surprised by this sudden change given the latest terrorist activity in Belgium that itself follows closely upon similar atrocities in Turkey and the Ivory Coast. These are the kinds of events that cannot be anticipated but must be accounted after the fact. After the fact, these tragedies found a market floating on good momentum and ever-strengthening sentiment alongside a broadening rally. The weight is now heavy in more ways than one. At least I personally cannot help shake that sinking feeling even as I know this too shall pass. In other words, expecting a pullback for the S&P 500 (SPY) at this juncture that tests 200DMA support seems almost like a no-brainer…especially given such a test is only a 1% drop away.
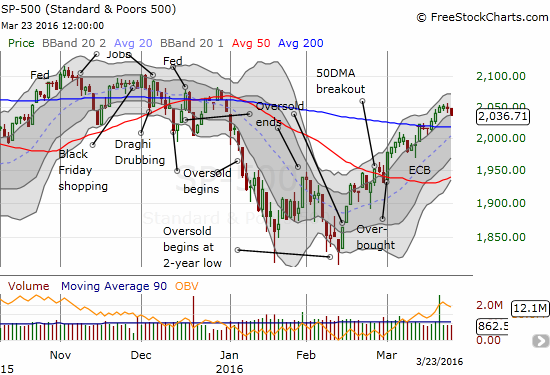
My favorite technical indicator, T2108, the percentage of stocks trading above their respective 40-day moving averages (DMAs) first went overbought on March 1st. It set the tone for trading for most of this month. However, after hitting the 80% range on March 3rd, T1208 has made no further progress. T2108 closed today at 81.6%. This lack of progress is fine if T2107, the percentage of stocks trading above their respective 200DMAs, is still making progress. Unfortunately, that progress came to a halt this week. T2107 has now recorded its first 3-day losing streak since the bounce from oversold conditions began on February 12th. It closed today at 39.3%. Even though the losses have been marginal, I am raising my alert level a bit.
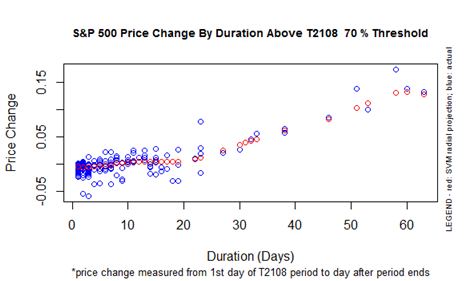
The S&P 500 is up 2.9% since T2108 first went overbought, including a very bullish 200DMA breakout. If this overbought period had ended today (day #17), we would have expected the S&P 500 to gain next to nothing for the overbought period. I base this observation on the chart of historical data below. So, the market is doing pretty well. If the overbought period ends in the next few days, we should expect downside risk of about 3%. If this overbought period can survive another week or so, I expect a fresh momentum and rally to take off.
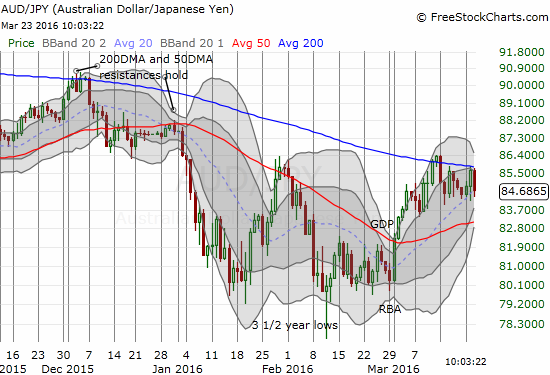
The Australian dollar (FXA) is now adding to my alert level. The Aussie STILL has failed to crack resistance against the Japanese yen (FXY). On today’s selling, AUD/JPY almost confirmed 200DMA resistance with a sharp reversal.
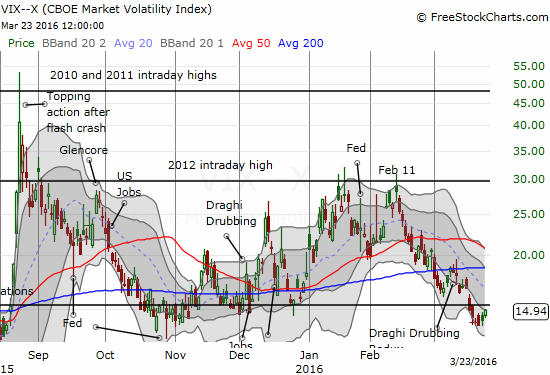
On the other hand, the volatility index, the VIX, has barely budged off recent lows. the VIX is even still below the 15.35 pivot. Market jitters are certainly nowhere near elevated yet.
Overall, I am keeping my short-term trading call at cautiously bullish. I am expecting that trading call will get tested within the next week.
I conclude with two contrasting charts that are of great interest.
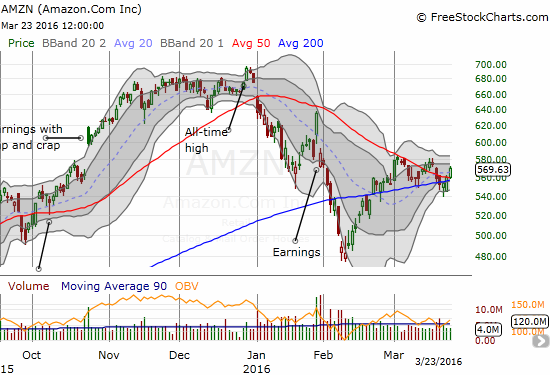
Amazon.com (AMZN) is breaking out for the second time in two weeks. In between was a breakdown. The 50 and 200DMAs have now perfectly converged. My instinct says this breakout is the “real deal,” but my caution says to wait to see buyers prove themselves by taking AMZN above the last high. I have also been burned twice trying to play both ends of the breaks from converged support/resistance.
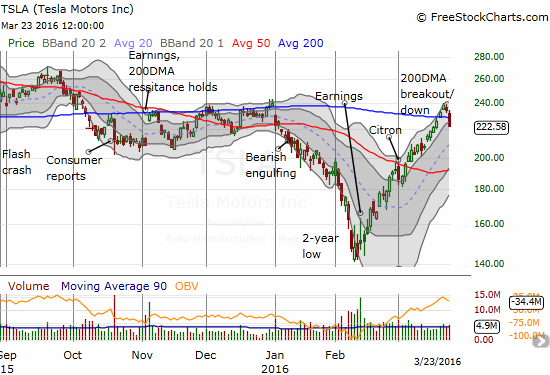
Tesla Motors (TSLA) has had a fantastic post-earnings run-up. TSLA gained a whopping 58% from its post-earnings close to the last high on Monday, March 21, 2016. This is incredible even for a momentum, cult-like stock like TSLA! Last week’s breakout seemed to herald yet more sustained momentum. Instead, TSLA broke right back down below its 200DMA today. I THINK this puts a 50DMA retest in play given the breathtaking run-up. Recent buyers MUST be itching to take profits here. If the breakdown gets confirmed with another day of selling, 50DMA support goes into play. If TSLA quickly overcomes this setback, I am waiting for a new high before assuming the previous momentum from the run-up has restarted…especially given the pivoting I have painfully experienced with AMZN.
— – —
For readers interested in reviewing my trading rules for an oversold T2108, please see my post in the wake of the August Angst, “How To Profit From An EPIC Oversold Period“, and/or review my T2108 Resource Page.
Reference Charts (click for view of last 6 months from Stockcharts.com):
S&P 500 or SPY
U.S. Dollar Index (U.S. dollar)
EEM (iShares MSCI Emerging Markets)
VIX (volatility index)
VXX (iPath S&P 500 VIX Short-Term Futures ETN)
EWG (iShares MSCI Germany Index Fund)
CAT (Caterpillar).
IBB (iShares Nasdaq Biotechnology).
Daily T2108 vs the S&P 500
")
Black line: T2108 (measured on the right); Green line: S&P 500 (for comparative purposes)
Red line: T2108 Overbought (70%); Blue line: T2108 Oversold (20%)
Weekly T2108

*All charts created using freestockcharts.com unless otherwise stated
The charts above are the my LATEST updates independent of the date of this given T2108 post. For my latest T2108 post click here.
Related links:
The T2108 Resource Page
Expanded daily chart of T2108 versus the S&P 500
Expanded weekly chart of T2108
Be careful out there!
Full disclosure: short AUD/JPY