
(T2108 measures the percentage of stocks trading above their respective 40-day moving averages [DMAs]. It helps to identify extremes in market sentiment that are likely to reverse. To learn more about it, see my T2108 Resource Page. You can follow real-time T2108 commentary on twitter using the #T2108 hashtag. T2108-related trades and other trades are occasionally posted on twitter using the #120trade hashtag. T2107 measures the percentage of stocks trading above their respective 200DMAs)
T2108 Status: 16.0% (second day at oversold)
T2107 Status: 21.9%
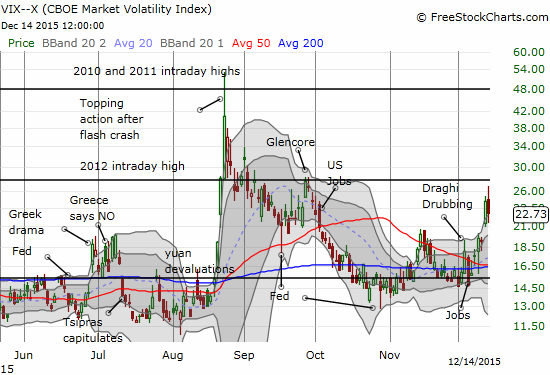
VIX Status: 22.7
General (Short-term) Trading Call: bullish
Active T2108 periods: Day #2 under 20% (oversold), Day #3 under 30%, Day #4 under 40%, Day #8 below 50%, Day #23 under 60%, Day #364 under 70%
Reference Charts (click for view of last 6 months from Stockcharts.com):
S&P 500 or SPY
SDS (ProShares UltraShort S&P500)
U.S. Dollar Index (volatility index)
EEM (iShares MSCI Emerging Markets)
VIX (volatility index)
VXX (iPath S&P 500 VIX Short-Term Futures ETN)
EWG (iShares MSCI Germany Index Fund)
CAT (Caterpillar).
IBB (iShares Nasdaq Biotechnology).
Commentary
In my last T2108 Update, I laid out a case for short-term gain as part of an oversold bounce but longer-term pain as part of deteriorating technicals. The action on December 14, 2015 included a little of both: an overall unconvincing bounce.
The S&P 500 (SPY) managed to eek out a 0.5% gain after trading as low as a 1.0% loss. This qualifies as a very modest oversold bounce. The lows extended well below the lower-Bollinger Band (BB) and formed a great setup for buying into an oversold bounce. At its lows, T2108 dropped as far as 13.4% – a VERY extended oversold condition. At its highs, the volatility index, the VIX, reached as far as 26.8% – just below the 2012 intraday high. Put it all together, traders got a very brief buying signal to trade an oversold bounce, especially as the market started pulling out of this funk. The S&P 500 even provided the psychologically important 2000 level as a convenient pivot point.
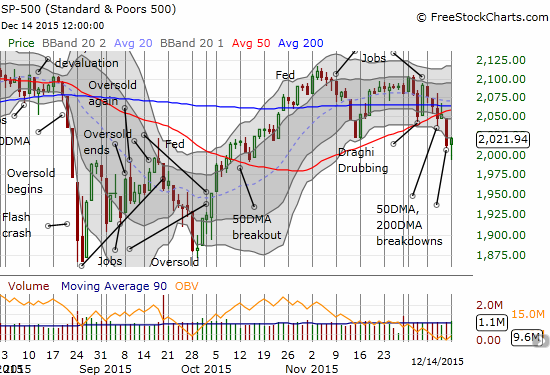
The bad news is that, once again, the poor breadth of the market reared its head. While the S&P 500 recovered for a small gain, T2108 closed with a loss. In other words, while the net result of the trading action left even more stocks in a worse technical condition, a few large stocks helped to push the S&P 500 over the hump. This poor breadth generated an unconvincing bounce which longer term flashes warning signs to me.
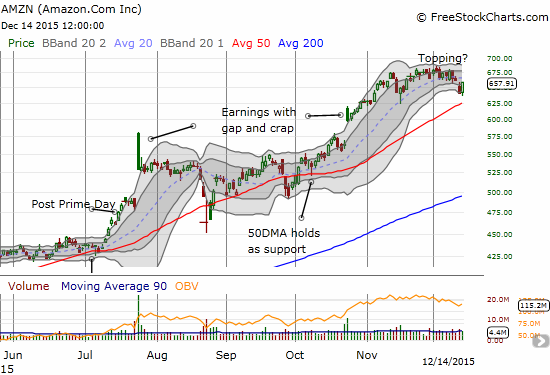
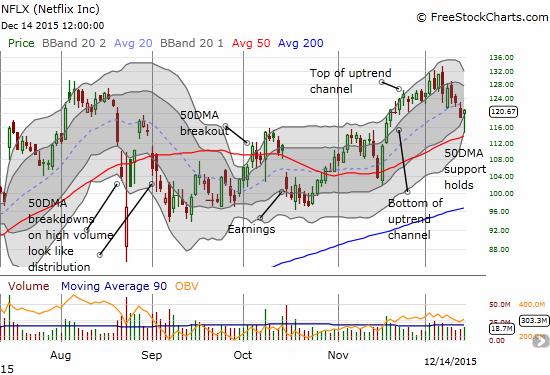
Two of those large stocks powering the index were Amazon.com (AMZN) and Netflix (NFLX). I traded the two as an offset in another attempt to try something a little different than the typical oversold trading strategy. AMZN ended up on the day with a cool 2.8% gain and only spent a very brief moment of time in the red. NFLX fared a lot worse during its selling but met a swell of buyers off critical 50DMA support.
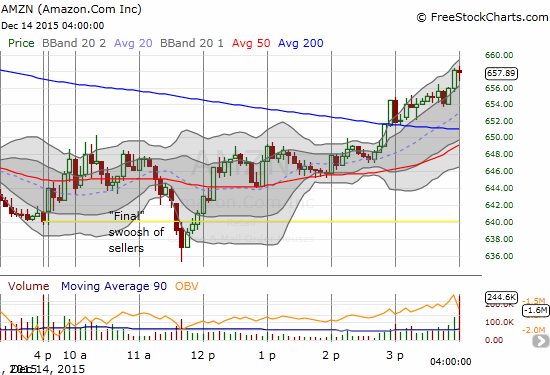
As I watched an early morning rally lose steam for AMZN, I decided to try a small and quick short. I watched as the stock eventually lost a quick 10 points…but I decided to hold even as the stock recovered (will likely be another hedge for making more aggressively bullish trades during the oversold period). On the daily chart, AMZN actually looks like it is topping. Before the strong close, the lower Bollinger Bands were creating a channel pointing downward that confirmed the bearishness of the previous day’s gap down.
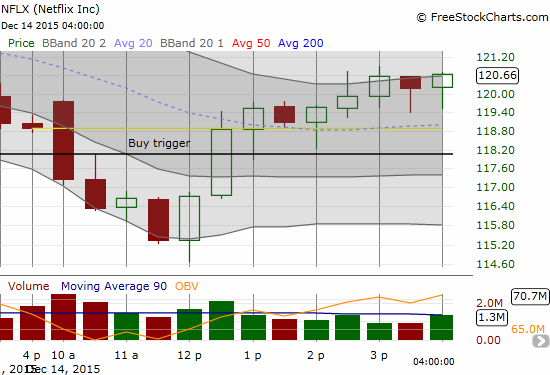
As I watched NFLX plunge, I resisted the typical urge to start loading up on call options as the stock approached critical support at its 50-day moving average (DMA). Instead, I set a trigger to buy my call options once NFLX crossed above a critical level of intraday resistance. I used a 30-minute chart (shown below) to determine a reasonable trigger point. I sold the calls after hitting a 50%+ gain. At the time, I thought the bounce from the lows was already long in the tooth. NFLX continued to rally right into the close.
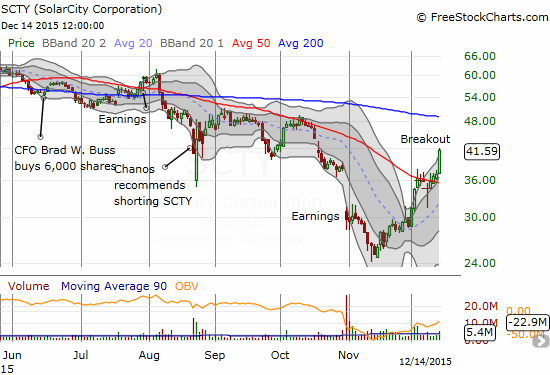
An interesting dynamic developed during the day with solar versus coal.
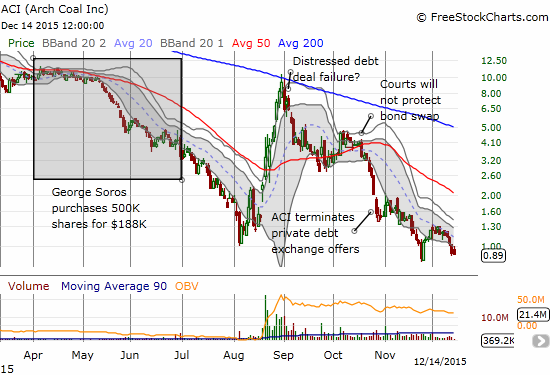
I have been touting the bullish setups of a few, select solar stocks. I did not think through the potential for solar stocks to pop upon a successful resolution of the climate change talks held in Paris. I also did not think about these talks as a wildcard to the “last chance” trade on Arch Coal (ACI). Needless to say, I am even MORE bullish on solar stocks now even with the market’s deteriorating technicals. I am also seeing the writing on the wall for ACI…
One trading day and a half before the Federal Reserve gets a chance to set a new course for the market.
Daily T2108 vs the S&P 500
")
Black line: T2108 (measured on the right); Green line: S&P 500 (for comparative purposes)
Red line: T2108 Overbought (70%); Blue line: T2108 Oversold (20%)
Weekly T2108

*All charts created using freestockcharts.com unless otherwise stated
The charts above are the my LATEST updates independent of the date of this given T2108 post. For my latest T2108 post click here.
Related links:
The T2108 Resource Page
Expanded daily chart of T2108 versus the S&P 500
Expanded weekly chart of T2108
Be careful out there!
Full disclosure: long SVXY shares, long SSO call options, short AMZN, long ACI call options, long NFLX call options