
(T2108 measures the percentage of stocks trading above their respective 40-day moving averages [DMAs]. It helps to identify extremes in market sentiment that are likely to reverse. To learn more about it, see my T2108 Resource Page. You can follow real-time T2108 commentary on twitter using the #T2108 hashtag. T2108-related trades and other trades are occasionally posted on twitter using the #120trade hashtag. T2107 measures the percentage of stocks trading above their respective 200DMAs)
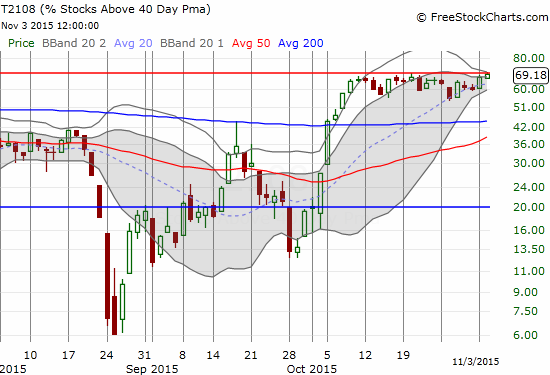
T2108 Status: 69.2%
T2107 Status: 35.8%
VIX Status: 14.5
General (Short-term) Trading Call: neutral
Active T2108 periods: Day #23 over 20%, Day #22 over 30%, Day #22 over 40%, Day #20 over 50%, Day #5 over 60% (overperiod), Day #337 under 70% (underperiod)
Reference Charts (click for view of last 6 months from Stockcharts.com):
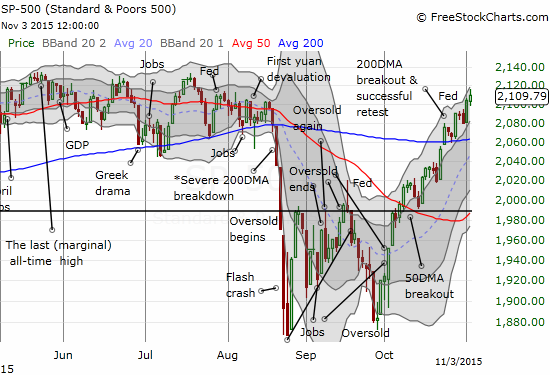
S&P 500 or SPY
SDS (ProShares UltraShort S&P500)
U.S. Dollar Index (volatility index)
EEM (iShares MSCI Emerging Markets)
VIX (volatility index)
VXX (iPath S&P 500 VIX Short-Term Futures ETN)
EWG (iShares MSCI Germany Index Fund)
CAT (Caterpillar).
IBB (iShares Nasdaq Biotechnology).
Commentary
For the first time since November 26, 2014, T2108 crossed over the overbought threshold of 70%. On that day, T2108 managed to slip just enough to fail the overbought test with a close of 69.99% (I do not round up). Just like that day, T2108 once again failed to hold overbought status. Today, it closed at 69.2%. T2108 has now gone 337 straight trading days in the 70% “underperiod.”
The S&P 500 (SPY) did its part by continuing the climb off the historic oversold conditions starting from the August Angst. Fresh all-time highs are now within sniffing distance – just a 1% rally away. Such an accomplishment without a break of the lows from the August Angst would stand out in the history of major corrections (see my post from September, 2015 “How The S&P 500’s Current Breakdown Increases The Odds Of Further Selling“).
The last time T2108 closed overbought was July 3, 2014. The 337 straight trading days in the 70% underperiod is the second longest streak I have recorded since 1986. The S&P 500 closed at 1985.44 on July 3rd. So the index has gained a very healthy 6.3% which is roughly in-line with “expected” performance if the 70% underperiod were to end today (it would end with a T2108 close in overbought territory). Here is the historical record (blue circles) overlayed with projected performance (red circles).
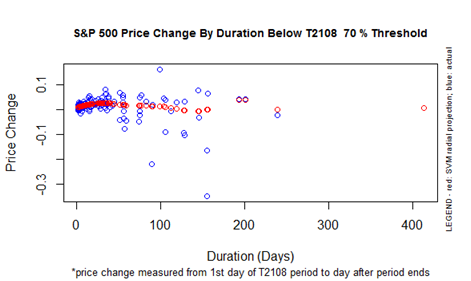
The above chart reminds me that the current period is an extreme outlier. The third longest streak with T2108 under 70% is around 250 trading days. Closing out this outlier period would be an important reset. It would set the stage for a potentially historic overbought period…or a major reversal in the case of buyer’s exhaustion.
The next large catalyst will likely be the jobs report at the end of this week. Until then, we may have to deal with continued tension at the border of overbought status.
The U.S. dollar index (DXY0) is also itching for a resolution that the jobs report might bring. The index is still struggling to follow-through on its major breakout last week.
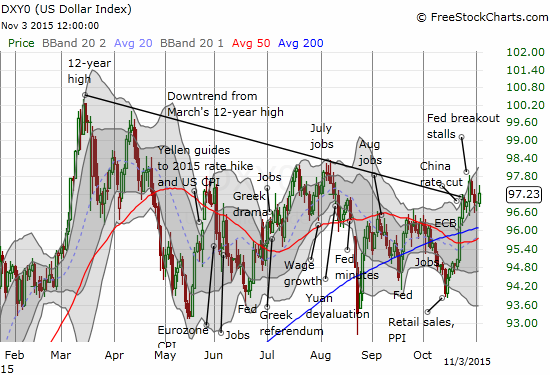
I have no particular forecast for the resolution of this tension. I am just standing ready to jump on a breakout or breakdown move. Just as I am chomping at the bit to hop off my neutral saddle for the S&P 500.
Chart of the day: King Digital (KING). Activision Blizzard (ATVI) will buy KING for $5.9B or $18/share. While this price is below the controversial company’s $22.50 IPO price back in March, 2014, I am sure there are plenty of bears screaming bloody murder. Bears had sold short 37.6% of KING’s shares as of October 15th. Another lesson in avoiding hanging around too long in a crowded trade. The stock incredibly traded 65.3M shares, not far from the entire float of 78.4M shares. I am guessing there are few traders still short this stock now.
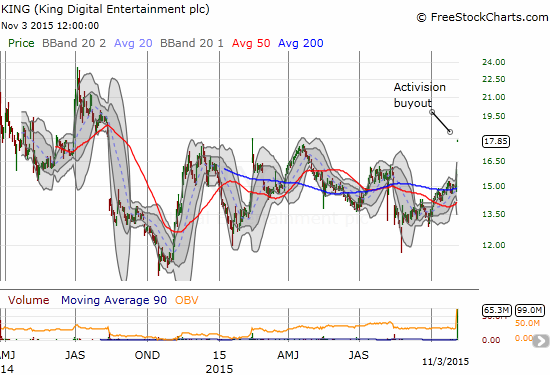
I last wrote about KING almost a year ago. I was stubbornly optimistic about the company at that time. I wish I had stayed on the case for buying dips. Another lesson learned!
Daily T2108 vs the S&P 500
")
Black line: T2108 (measured on the right); Green line: S&P 500 (for comparative purposes)
Red line: T2108 Overbought (70%); Blue line: T2108 Oversold (20%)
Weekly T2108

*All charts created using freestockcharts.com unless otherwise stated
The charts above are the my LATEST updates independent of the date of this given T2108 post. For my latest T2108 post click here.
Related links:
The T2108 Resource Page
Expanded daily chart of T2108 versus the S&P 500
Expanded weekly chart of T2108
Be careful out there!
Full disclosure: net long the U.S. dollar