
(T2108 measures the percentage of stocks trading above their respective 40-day moving averages [DMAs]. It helps to identify extremes in market sentiment that are likely to reverse. To learn more about it, see my T2108 Resource Page. You can follow real-time T2108 commentary on twitter using the #T2108 hashtag. T2108-related trades and other trades are sometimes posted on twitter using the #120trade hashtag. T2107 measures the percentage of stocks trading above their respective 200DMAs)
T2108 Status: 61.6%
T2107 Status: 48.2%
VIX Status: 17.2
General (Short-term) Trading Call: Bearish until T2108 goes overbought AND the S&P 500 closes at a new all-time high
Active T2108 periods: Day #78 over 20%, Day #37 above 30%, Day #17 over 40%, Day #6 over 60% (overperiod), Day #148 under 70%
Reference Charts (click for view of last 6 months from Stockcharts.com):
S&P 500 or SPY
SDS (ProShares UltraShort S&P500)
U.S. Dollar Index (volatility index)
EEM (iShares MSCI Emerging Markets)
VIX (volatility index)
VXX (iPath S&P 500 VIX Short-Term Futures ETN)
EWG (iShares MSCI Germany Index Fund)
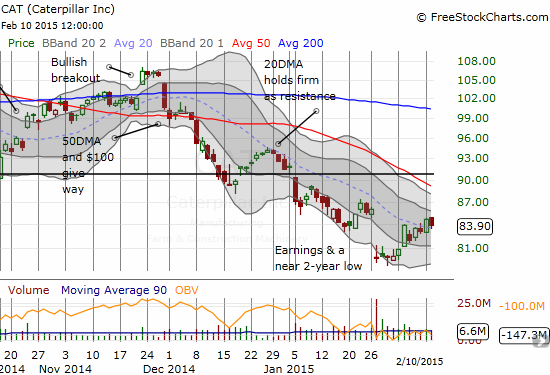
CAT (Caterpillar).
Commentary
As I like to say, it is HARD being bearish on the market when Apple, Inc (AAPL) is trading bullishly.
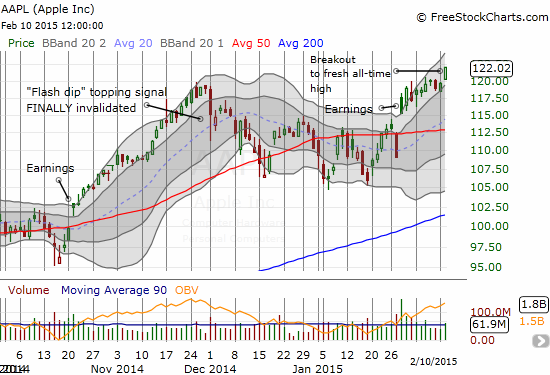
AAPL became the first company ever to surpass $700B in value today. The chart above shows that AAPL has now invalidated the previous bearish chart signals that worried me. The perfect bounce off the first Bollinger Band (BB) opens up the strong potential for a fresh run-up. The Apple Trading Model (ATM) predicted the opposite direction for the day unfortunately. So, I will be playing some catch-up assuming AAPL does indeed launch into a fresh uptrend.
My trading bias remains bearish on the overall market because the rally for the S&P 500 (SPY) failed to break the top of the trading range…
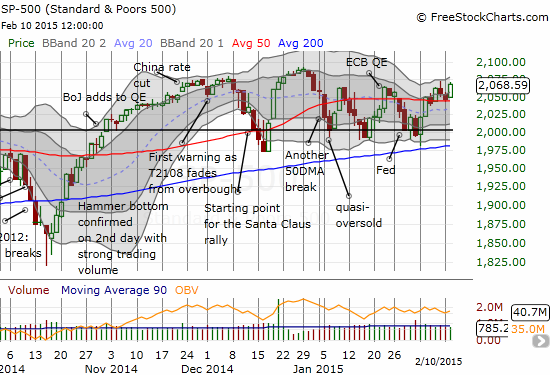
…and T2108 barely managed to eke out a gain after spending most of the day in negative territory.
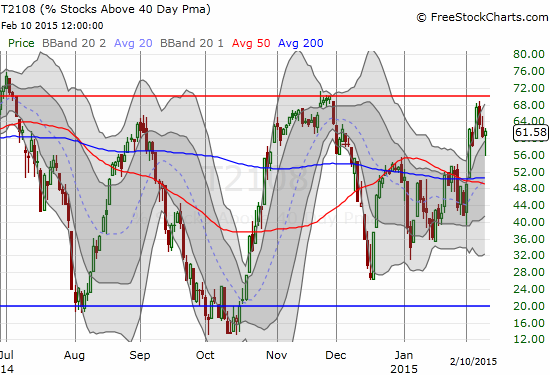
This divergence implies that the day’s rally was led by a small group of stocks. Bulls and buyers still have a lot to prove beyond putting AAPL firmly back into bullish territory.
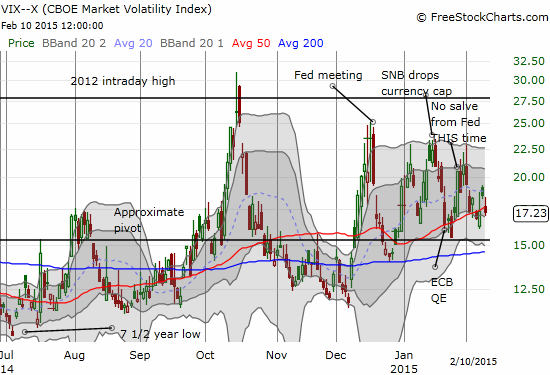
The volatility index is still hanging tough as it pivots around its 50DMA. It is still in position to launch off approximate support at any time.
All this means it makes plenty of sense to press my bet on my favorite hedge on bullishness, Caterpillar, Inc. (CAT). I doubled down on my March puts right after trading opened for the day.
While we wait to see whether the market can finally break out or whether we will need to endure yet more chop, here are some charts of interest. These are all bullish and will be even MORE interesting once/if the market finally breaks out and launches an extended overbought rally.
Conn’s (CONN)
CONN has amazingly gained another 20% since since I sold my call options. I of course wish I had been more patient but suffering through that fade in December on the previous CONN trade really made me extra eager to lock in profits this time around.
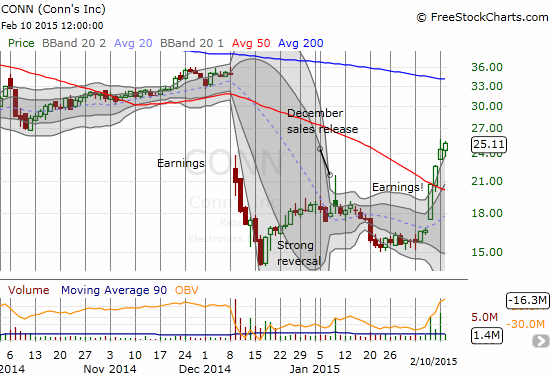
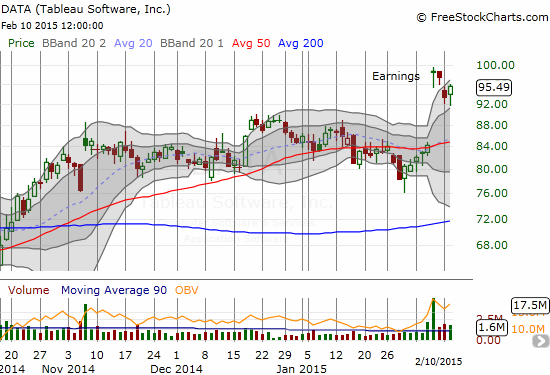
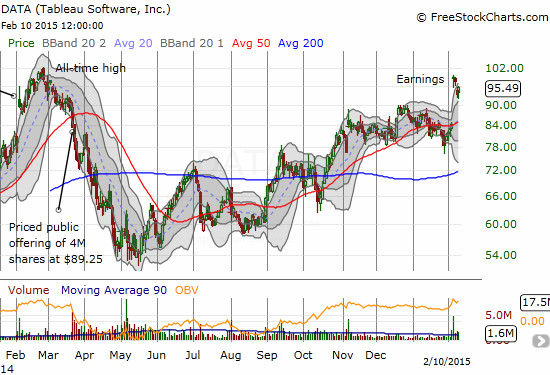
Tableau Software (DATA)
In my last T2108 Update, I discussed the pre-earnings trade set-up in Splunk (SPLK) after it gapped up in sympathy with bullish earnings from DATA. SPLK has now sold off the last two days back to its 50DMA. It suddenly occurred to me to check on DATA and, sure enough, the stock was also pulling back from its post-earnings gains. I did not hesitate to make a bullish bet with call options as DATA neared its first Bollinger Band. So far, so good, as DATA smartly bounced off support. I am looking for DATA to resume its upward momentum past its post-earnings high.
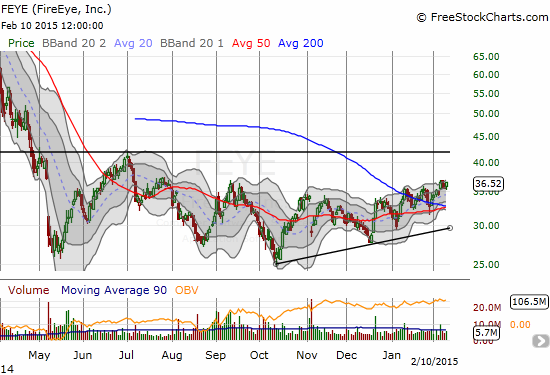
FireEye (FEYE)
FEYE will be reporting earnings Wednesday evening. I will be watching closely as the chart below shows the stock has been trending upward into a potential breakout.
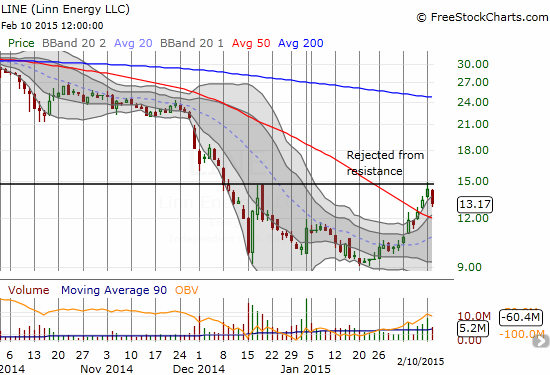
I just discussed a change in my oil-related trades that involved locking in profits in call options on Linn Energy (LINE). It was well-timed precaution as LINE smartly pulled back from resistance. Near the close, I decided to use some of those profits to buy back a few March call options. I do not plan on expanding the position although I might consider a new one if LINE crumbles all the way back to $10 or so (depending on the dynamics in the oil market at that time of course).
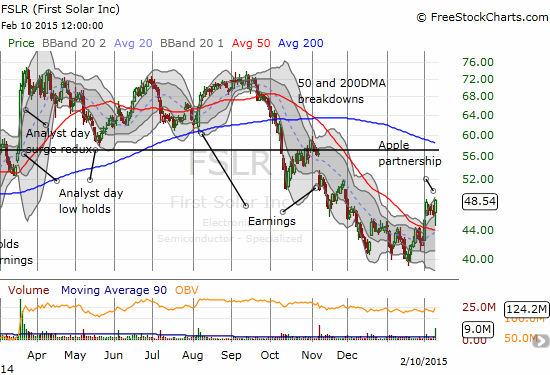
First Solar (FSLR)
FSLR continued a theme on the day of smart bounces off support and lows. I doubled down on FSLR call options as it approached its 50DMA support. This is part of my new hedged trade on solar stocks (a separate piece still to come on this!). Going into the close, FSLR rallied smartly on news that Apple (AAPL) will partner with FSLR on an $850M solar farm. This news should work wonders for sentiment in solar stocks which have slumped in parallel with energy and commodities. Now it looks like the latest bounce in late January might actually hold.
So, overall, there are PLENTY of reasons to get constructive on the market again, but I still want to see the S&P 500 and T2108 partner up to prove the bullishness.
Daily T2108 vs the S&P 500
")
Black line: T2108 (measured on the right); Green line: S&P 500 (for comparative purposes)
Red line: T2108 Overbought (70%); Blue line: T2108 Oversold (20%)
Weekly T2108

*All charts created using freestockcharts.com unless otherwise stated
The T2108 Resource Page
Expanded daily chart of T2108 versus the S&P 500
Expanded weekly chart of T2108
Be careful out there!
Full disclosure: long DATA calls, long SPLK calls and puts, long AAPL puts, long LINE calls,