
(T2108 measures the percentage of stocks trading above their respective 40-day moving averages [DMAs]. It helps to identify extremes in market sentiment that are likely to reverse. To learn more about it, see my T2108 Resource Page. You can follow real-time T2108 commentary on twitter using the #T2108 hashtag. T2108-related trades and other trades are sometimes posted on twitter using the #120trade hashtag. T2107 measures the percentage of stocks trading above their respective 200DMAs)
T2108 Status: 64.5%
T2107 Status: 50.6%
VIX Status: 14.7
General (Short-term) Trading Call: Neutral – waiting to see what happens when/if T2108 becomes overbought
Active T2108 periods: Day #81 over 20%, Day #40 above 30%, Day #20 over 40%, Day #9 over 60% (overperiod), Day #151 under 70%
Reference Charts (click for view of last 6 months from Stockcharts.com):
S&P 500 or SPY
SDS (ProShares UltraShort S&P500)
U.S. Dollar Index (volatility index)
EEM (iShares MSCI Emerging Markets)
VIX (volatility index)
VXX (iPath S&P 500 VIX Short-Term Futures ETN)
EWG (iShares MSCI Germany Index Fund)
CAT (Caterpillar).
Commentary
The S&P 500 (SPY) finally closed at a new all-time high on Friday, February 13, 2015, but T2108 is still failing to cooperate. T2108 tentatively closed at 64.5%, still short of overbought status. This “reluctant” behavior of T2108 relative to the S&P 500 was also evident on Wednesday when T2108 notably declined even as the S&P 500 closed essentially flat.
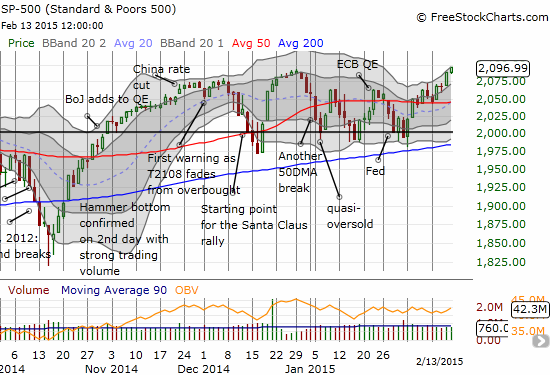
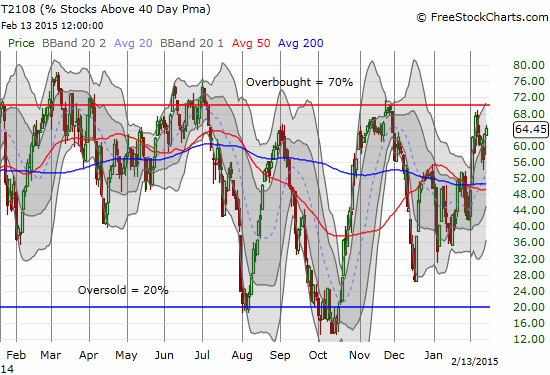
I am wary about this reluctance because the S&P 500 was trading at the top of the 2015 trading range when T2108 last flirted with overbought status. With the S&P 500 now around 1.5% higher, T2108 should be overbought by now, if not at least retesting that boundary. This failure means that the recent surge has left some stocks behind, at least for now. As a result, I remain very wary of the market overall even as I switched the trading bias from bearish to neutral. This is a very difficult juncture for making short-term trading calls because the S&P 500 and T2108 could combine to flash a bullish signal that quickly turns into a fakeout. Here are my current trading rules for trying to cope with these tricky circumstances:
- Stay neutral as long as the S&P 500 is rallying and T2108 has not yet obtained overbought status.
- Flip bullish once T2108 becomes overbought (looking for the elusive extended overbought rally)
- Flip bearish as soon as the S&P 500 closes below today’s low, around 2086. I will be MORE bearish if this occurs after T2108 achieves overbought status.
The last rule is particularly important because the recent history of overbought periods has produced sell-offs and pullbacks in their immediate wake. The last extended overbought rally was two years ago. The S&P 500 even managed to keep rallying after T2108 dropped from overbought status. As regular readers know, trading through overbought periods is a LOT tougher than oversold periods. So, we will have to stay on our toes!
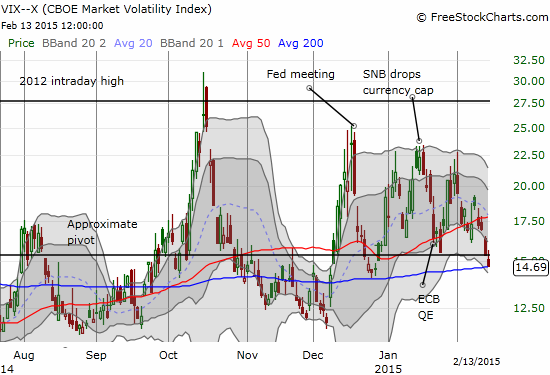
The volatility index, the VIX, adds to the intrigue. I have been writing that the volatility index is likely to remain elevated for the foreseeable future. On Friday, the VIX fell below the 15.35 pivot. Traders can argue that this could set up the next bounce in volatility, especially given what happened in late December. If the VIX closes above the pivot, I will consider the move supportive of the bearish case. In the meantime, a falling VIX and a rising S&P 500 are VERY bullish one-two punches. I wish I still had an active anti-volatility trade in place.
In the last two T2108 Updates, I produced some very tradeable charts. Most have produced some good follow-through. Here, I provide two updates and some new charts of interest.
FireEye (FEYE)
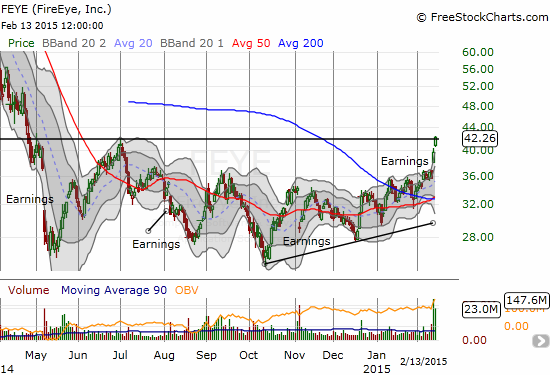
FEYE got back on my radar because of pending earnings and technicals that suggested a big breakout could be on the way. Sure enough, FEYE reported earnings that sent the stock to an 11% gain on Thursday. On Friday, the stock gained another 7% to crack the breakout point. With the bullish confirmation of the earnings response, I aggressively bought call options on the first post-earnings dip, timed for a pullback to the upper-Bollinger Band (BB). I was prepared for an extended and slow trade off or around that support. When the stock immediately bounced, I locked in my profits soon after FEYE made a fresh post-earnings high. If I had held on another day, those profits would have increased almost 4x!
Interestingly, the previous 4 earnings for FEYE all had negative responses (three are shown in the chart below). So it is very possible this positive response to earnings will deliver a sustained breakout.
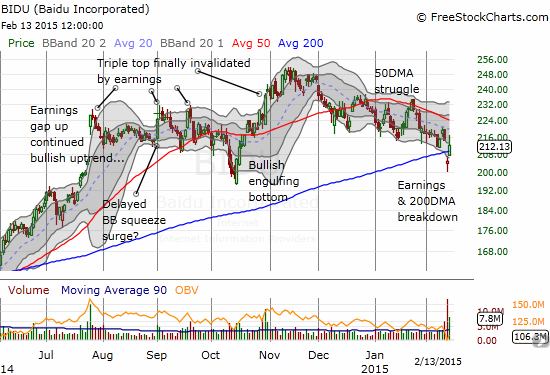
Baidu (BIDU)
BIDU was also on my post-earnings radar. The stock suffered a tremendous hit. In after-hours trading the stock dropped as far as $193 or so for a 10% loss. So imagine my surprise when BIDU managed to open 10 points higher. Given what I saw with Google (GOOG) last month, I interpreted this bounce as very bullish. My order of call options triggered as BIDU dropped toward $200. I held my breath as BIDU hit $200. Fortuitously, that round number held up this time as support. Unlike FEYE, I held onto the position into Friday. I was rewarded with a gap up. I locked in profits soon after that as I expected an extended fight with 200DMA resistance. Amazingly, BIDU continued soaring to completely close its post-earnings loss. I do not even want to calculate the missed profit opportunity on that one!
I think it is safe to say that BIDU is primed to rally even with a declining 50DMA that has proven itself as tough resistance since December.
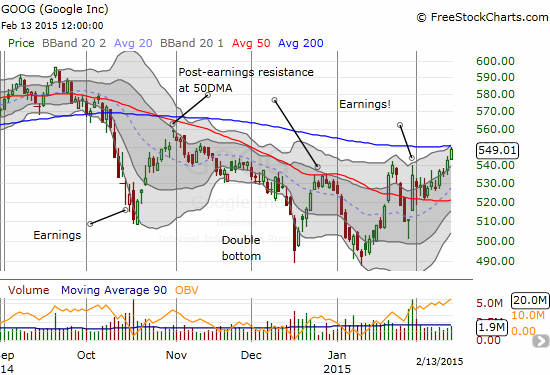
Google (GOOG)
Speaking of GOOG, the stock’s post-earnings recovery continues. The stock is now right below its 200DMA. A breakout from here will be VERY bullish. I will have to assume that the selling that has preceded the last two earnings has finally shaken out the GOOG bears. Accordingly, note the convincing strength in on-balance volume (OBV).
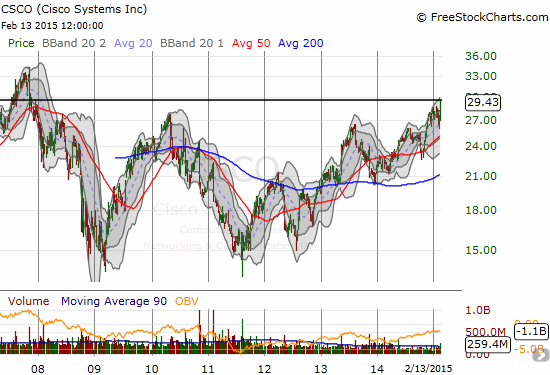
Cisco (CSCO)
CSCO was not on my post-earnings radar. The gap up to levels last seen in late 2007 caught my attention. As in the case of FEYE and BIDU, I moved quickly to load up on call options. Like FEYE, CSCO gave me an opportunity to buy on a pullback to the top of the Bollinger Band. For whatever reason, it was CSCO that I thought could have sustained follow-through, so I held onto my call options even as the stock rapidly bounced back and delivered profits. My position is now back to flat, and I am counting on a resumption of the buying enthusiasm in the coming week.
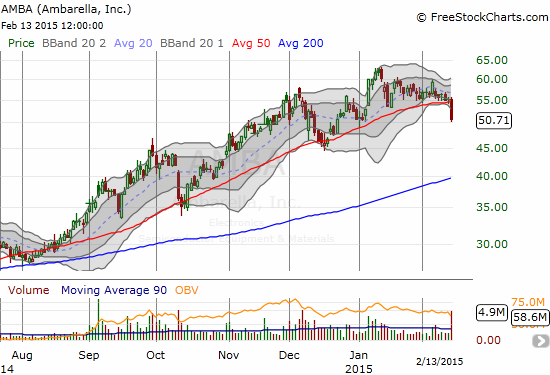
Ambarella, Inc. (AMBA)
Here is a more bearish setup so you do not get the impression I am actually an aggressive bull despite all the wariness I expressed earlier about the general market. AMBA broke through its 50DMA on high volume but on no publicly reported news. Many times in these cases I will wait for the news before making a move. Sometimes I will even try to fade the move if it is a stock I know and like. This time, I automatically made the move consistent with the breakdown and loaded up on put options. With the stock trading below its lower-BB, I was definitely tempted to quickly lock in profits. With memories of trades closed too quickly fresh on my mind, I decided to hold on and see at least what Tuesday brings.
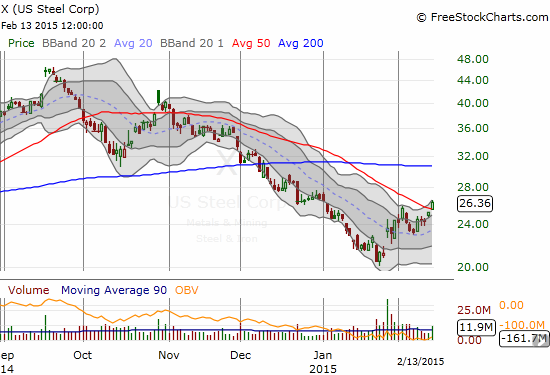
United States Steel Corp (X)
Now back to bullish developments. An apparent bottoming in oil has likely helped United States Steel Corp (X) churned its way into a bottoming pattern. I took a tentative position call options on X last week after it seemed to confirm the bullish gap up from earnings. Friday’s breakout above 50DMA resistance seems to add a bullish confirmation of a bottoming process.
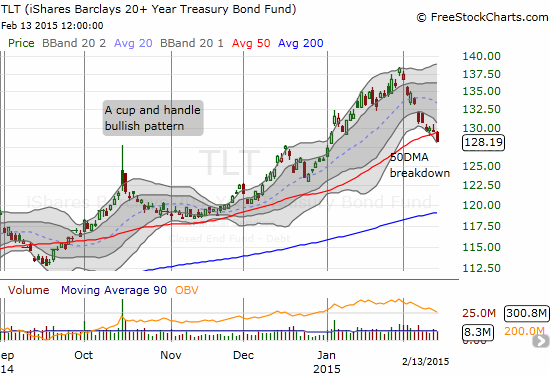
iShares 20+ Year Treasury Bond (TLT)
A week ago, I was looking to TLT holding support at its 50DMA. I even started buying call options ahead of confirmation of support. No dice. On Friday, TLT broke through that support. This is a chart of GREAT interest because a continued decline in bond prices could help confirm the current bottoming of commodities like oil. In other words, we can interpret increasing yields as the market’s (reluctant?) acceptance that prices are more likely heading higher than lower from here. Since rates move for a lot of different reasons, I am not talking about a direct correlation, just something to give strong consideration.
Daily T2108 vs the S&P 500
")
Black line: T2108 (measured on the right); Green line: S&P 500 (for comparative purposes)
Red line: T2108 Overbought (70%); Blue line: T2108 Oversold (20%)
Weekly T2108

*All charts created using freestockcharts.com unless otherwise stated
The T2108 Resource Page
Expanded daily chart of T2108 versus the S&P 500
Expanded weekly chart of T2108
Be careful out there!
Full disclosure: long call options in X, TLT, and CSCO; long AMBA puts