
(T2108 measures the percentage of stocks trading above their respective 40-day moving averages [DMAs]. It helps to identify extremes in market sentiment that are likely to reverse. To learn more about it, see my T2108 Resource Page. You can follow real-time T2108 commentary on twitter using the #T2108 hashtag. T2108-related trades and other trades are sometimes posted on twitter using the #120trade hashtag. T2107 measures the percentage of stocks trading above their respective 200DMAs)
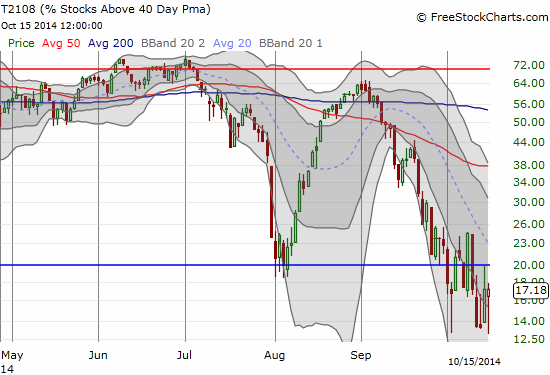
T2108 Status: 17.2% (5th day of 3rd oversold period in last 11 trading days)
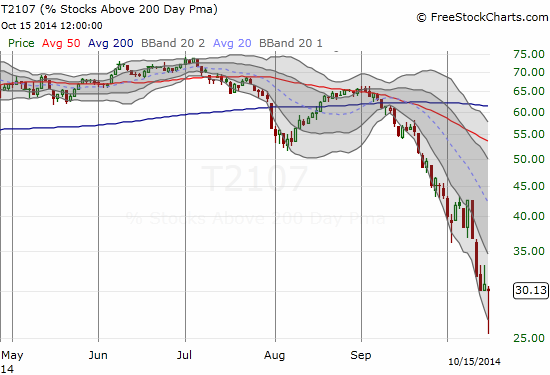
T2107 Status: 30.1% (low was 25.4%!)
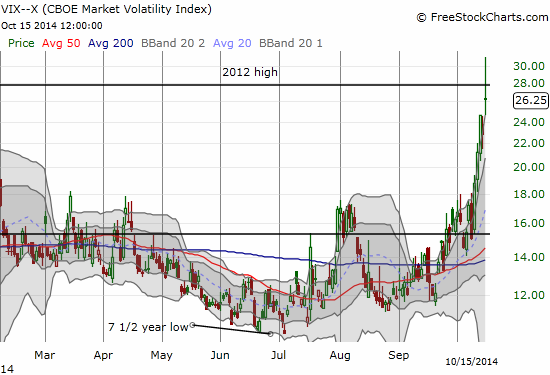
VIX Status: 26.3 (intraday high was 31.1, surpassing the 2012 high!)
General (Short-term) Trading Call: Continue reducing shorts – although aggressive traders can hold remaining shorts until S&P 500 recovers and closes above its 200DMA again; aggressive traders could have added to or started positions when VIX cracked the 2012 high although, per earlier advice, waiting until the VIX confirms the end of momentum makes a LOT of sense now; conservative traders can continue to wait until T2108 exits oversold conditions OR the S&P 500 closes above its 200DMA. See below for more details and explanations
Active T2108 periods: Day #5 under 20% (5th day of oversold period), Day #17 under 30%, Day #23 under 40%, Day #25 under 50%, Day #27 under 60%, Day #69 under 70%
Reference Charts (click for view of last 6 months from Stockcharts.com):
S&P 500 or SPY
SDS (ProShares UltraShort S&P500)
U.S. Dollar Index (volatility index)
EEM (iShares MSCI Emerging Markets)
VIX (volatility index)
VXX (iPath S&P 500 VIX Short-Term Futures ETN)
EWG (iShares MSCI Germany Index Fund)
CAT (Caterpillar).
Commentary
The bulls and buyers FINALLY drew a line in the sand today. It was a dramatic day of sell-off and recovery. The advance had to reach so far and so long though, I will not be surprised to see a lot of churn back and forth instead of a moonshot back to overhead resistance. Pictures tell this story well, so let’s dive right in.
BOTH the S&P 500 (SPY) and the NASDAQ (QQQ) went negative for the year at today’s lows. The stock market can be a cruel beast as it takes away in a flash what took months to build.

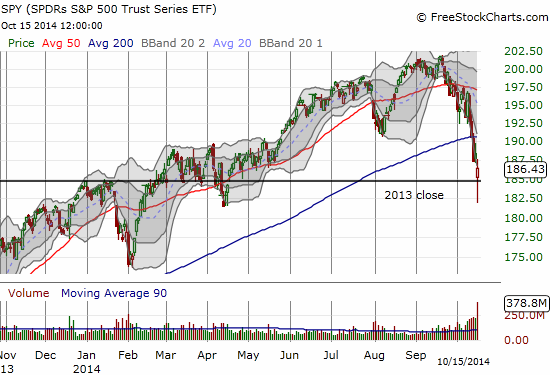
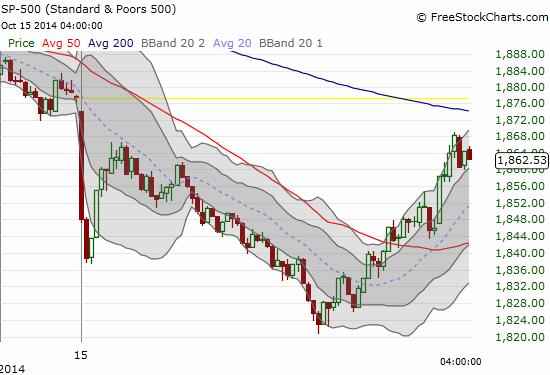

To me, that was an insane plunge below the lower-Bollinger Band (BB), especially for the S&P 500. It was an awesome display of the fear that has gripped the market. The equally incredible comeback was also a sight to behold. As awful as it feels, the trading opportunities are too numerous to count…for bears AND bulls.
As you can imagine, the VIX also put on an awesome display. It cracked the 2012 high before getting faded hard to end the day. Like the indices, the VIX also stretched too far away from its Bollinger Band. So in the span of just 3 months, the VIX has gone from 7 1/2 year lows to near 4-year highs (not shown in the chart below). As I heard one commentator say…the market has sharply shifted from worrying about NOTHING to worrying about EVERYTHING. (For more on the prospects for volatility, I strongly recommend you read my post “Stern Warnings To Financial Markets“).
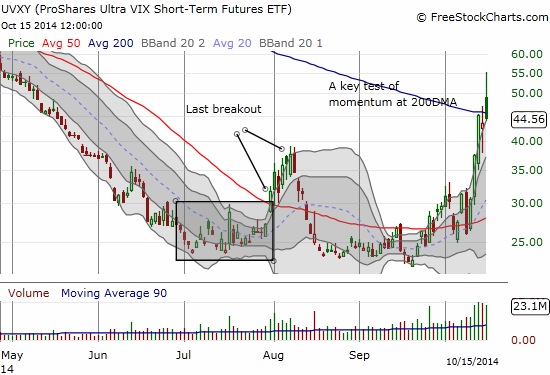
The revenge of the ProShares Ultra VIX Short-Term Futures (UVXY) continues. Amazingly, not only has UVXY managed to printed a higher high, but also it has traded above its 200DMA twice in the past two days. I have duly noted the failure to CLOSE above this important trendline. This failure could also be signalling the run-up is closer to its end than its beginning. Many traders who chased UVXY higher are already sitting on nasty 1-day losses of as much as 20%. They should be quite eager to get out. I hope no regular reader of mine was chasing anything to the extremes today!
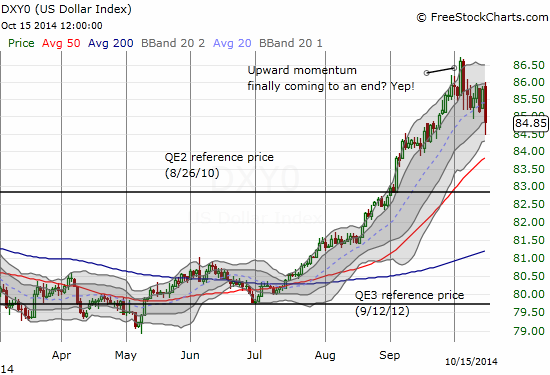
Another sliver of positivity came from the currency market where the U.S. dollar (UUP) went into fresh convulsions. The currency index has certainly lost its momentum for now, and it set in motion a dizzying array of vacillations on the day.
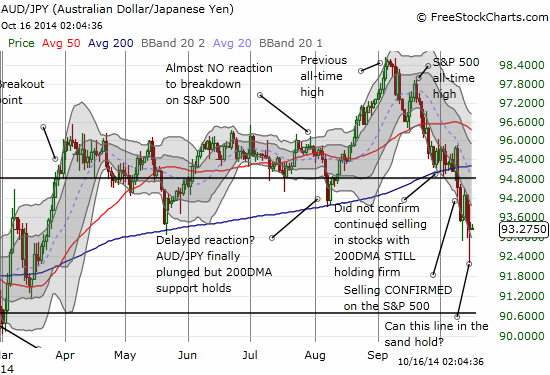
I wish I could spend the hours needed to untangle the many intricate things going on in the currency market right now. Instead, I will focus in on the Australian dollar (FXA) and the Japanese yen (FXY) again. When the indices plunged to their depths, AUD/JPY accompanied them in a loud statement of affirmation and confirmation. AUD/JPY punched to fresh lows and created solid bearish confirmation. But the subsequent bounce just as quickly erased away the hurt feelings. On the margin, AUD/JPY is providing hope that the lows are here. I continue to watch this closely.
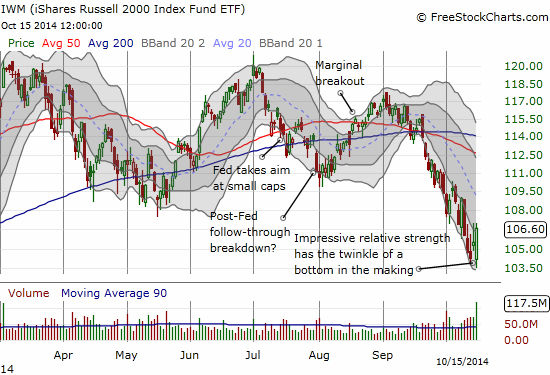
Many traders noted the impressive relative strength on iShares Russell 2000 (IWM). It actually ended the day with a GAIN of 1.0%. Very impressive for such a day of otherwise vicious selling. However, not even the resilient small caps are out of the woods until they break the vicious downward channel that is in place between the Bollinger Bands. Let’s say a close of 108 or so brings some sunshine back in. Note the high volume on the day – a good sign of a potential washout of sellers.
Adding to a bit of sunshine, T2108 may have printed a bit of bullish divergence. Even when the stock market’s selling was at its worst, my favorite technical indicator refused to print a new low for this cycle. Granted, at these levels, it gets harder and harder to find stocks to plunge below their 40DMAs, but we have to take positive signs where we can get them. A positive close would have sealed the deal on bullish divergence.
T2107, the percentage of stocks trading above their 200DMAs, was not so optimistic. It plunged to a fresh low, levels last seen almost 3 years ago, before joining the bullish rush in the afternoon’s trading session. Theoretically, T2107 could still fall a LOT further. While T2108 has churned in a wide range this month, T2107 has broken down from a previous period of consolidation.
Now it is time to weave together these indicators into the “so what?” I will try by referring back to the three trading themes (or memes) I introduced in the last T2108 Update.
The aggressive “I don’t want to miss the rally” trade
I fall most closely into this camp, so I will lead off with this aggressive theme.
It has been tough sledding going for gold as the market has failed every challenge during this vicious oversold period. At each VIX hurdle, I pulled the trigger for some ProShares Ultra S&P500 (SSO) call options, anticipating the same kind of fantastic reward I received from the first of the three oversold periods. No luck. With the benefit of hindsight, I should have held my UVXY shares given my overall bullish outlook on volatility. I just never imagined the VIX would go so high. Yes, I know that uncertainty is exactly why I should have held onto UVXY as a valuable hedge.
I see a lot more positives than negatives now. Signs are converging toward a bounce IF T2107 can avoid fresh lows. It does not appear T2108 will go any lower for this cycle. IWB is very encouraging as a sign of relative strength. At the time of typing, the currency market is still cooperating with AUD/JPY staying aloft. STILL, I am now more comfortable waiting for a notable pullback in the VIX before getting aggressive again.
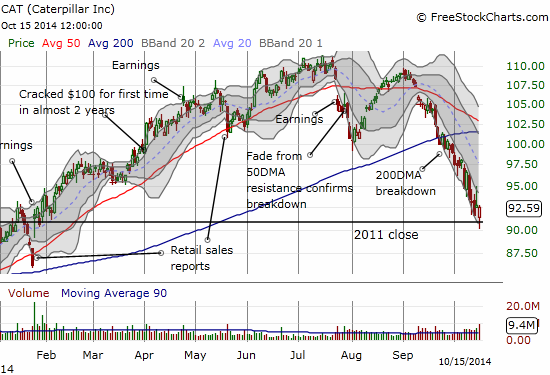
I have become so cautious that in the last round I only bought a few SSO call options (thank goodness). And even with today’s monster move, I did not get as aggressive as my rule book says I should. Instead, I spread out a few bets. One example of such a bet was, gasp, Caterpillar (CAT). My earlier prediction of a freefall has played out even “better” than I could have expected. After selling my latest round of puts, I realized that CAT was setting up for another bounce toward the upward limit of its downward channel. After CAT bounced back above its 2011 close, I made the move for call options. I thankfully ended the day solidly green on this position. Instead of selling right away, I decided to wait at least one more day to see whether CAT will continue the run.
$CAT back to where it closed out 2011…Looking for bounce at least back to top of vicious downward channel.
— Dr. Duru (@DrDuru) October 15, 2014
I will get aggressive again ONLY once I see the VIX make a confirmation move downward. Currently, that would be a move below 21. This bar moves up the higher the VIX trades. Of course, such a pullback will likely place T2108 out of oversold territory…melding me right into the conservative trading rules.
The conservative “wait and see” trade
Conservative traders continue to stay happily on the sidelines. The rules remain the same: do not even think of buying until T2108 closes outside of oversold territory. Even better, perhaps wait until the S&P 500 can recapture its 200DMA. At the current pace, the end of this oversold period will likely occur perilously close to 2000DMA resistance.
The growling bear trade
Stubborn bears who have held through all the oversold churn are still hooting, howling, and growling in glee. They are still in the driver’s seat with the 200DMA breakdown. However, if they have not been covering any shorts, their greed is pushing them dangerously close to a payback moment. The bounce from today’s depths are sending bears a big yellow caution sign. Regardless, the 200DMA provides a very clear dividing line between pressing the bearish case and abandoning ship.
Conclusion
Buyers and bulls finally managed to draw a line in the sand with the lows on Wednesday. Advantage bulls until/unless this low melts away.
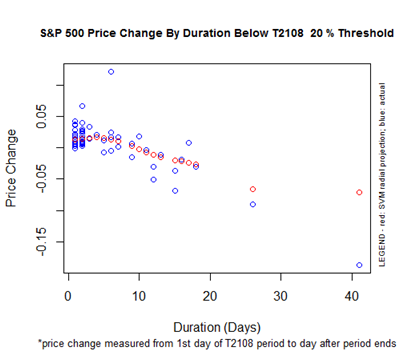
All traders should be watching the clock. This oversold period is now 5 days long. Now that the duration is sailing past the median and mean duration for an oversold period, I am now watching for the next milestone: 10 days. After 10 trading days in oversold territory, the expected performance of the S&P 500 turns decidedly negative. Stay tuned!
And if you need some feel-good words (bears excluded of course), here is an assessment on the U.S. economy from Wells Fargo’s (WFC) Chairman and CEO, John Stumpf. This quote is from the Seeking Alpha transcripts of Q3 2014 Results:
“While the path to a full economic recovery remains uneven, including the volatility we’ve seen recently and the current low rate environment provides some challenges, I am very optimistic about the future. The U.S. economy added 248,000 jobs last month, the 48 straight monthly employment gain tying the record for the longest consecutive string of job gains ever.
There are currently more job openings than at any time since early 2001. Household wealth is at an all-time high and after years of paying down debt, the consumer debt burden is at the lowest level in over 30 years. Consumers are now better positioned for increased spending and borrowing.
The U.S. economy is also benefiting from the increasing domestic oil and gas productions, which is at the highest level in almost 30 years and rising fast, up 14% over the past year. Fiscal conditions have improved at all levels of government, and government payrolls are once again on the rise for the first time this decade.”
Hey, I even caught a blurb on the news Wednesday morning the that U.S. budget deficit is actually back to 2007 levels…
Daily T2108 vs the S&P 500
")
Black line: T2108 (measured on the right); Green line: S&P 500 (for comparative purposes)
Red line: T2108 Overbought (70%); Blue line: T2108 Oversold (20%)
Weekly T2108

*All charts created using freestockcharts.com unless otherwise stated
The T2108 Resource Page
Expanded daily chart of T2108 versus the S&P 500
Expanded weekly chart of T2108
Be careful out there!
Full disclosure: long SSO call options and shares, long UVXY puts, net short the Australian dollar, long CAT calls