
(T2108 measures the percentage of stocks trading above their respective 40-day moving averages [DMAs]. It helps to identify extremes in market sentiment that are likely to reverse. To learn more about it, see my T2108 Resource Page. You can follow real-time T2108 commentary on twitter using the #T2108 hashtag. T2108-related trades and other trades are sometimes posted on twitter using the #120trade hashtag. T2107 measures the percentage of stocks trading above their respective 200DMAs)
T2108 Status: 13.5% (3rd day of 3rd oversold period in last 9 trading days, a new 38-month closing low)
T2107 Status: 30.1% (a fresh 34-month low)
VIX Status: 21.2 (intraday high was a 22-month high)
General (Short-term) Trading Call: Continue reducing shorts – although aggressive traders can hold remaining shorts until S&P 500 recovers closes above its 200DMA again; aggressive traders should have added to positions when VIX cracked the new high (yes, yet again!); conservative traders can continue to wait until T2108 exits oversold conditions OR closes above its 200DMA. There are several important caveats and nuances here, so please read below for more details.
Active T2108 periods: Day #3 under 20% (3nd day of oversold period), Day #15 under 30%, Day #21 under 40%, Day #23 under 50%, Day #25 under 60%, Day #67 under 70%
Reference Charts (click for view of last 6 months from Stockcharts.com):
S&P 500 or SPY
SDS (ProShares UltraShort S&P500)
U.S. Dollar Index (volatility index)
EEM (iShares MSCI Emerging Markets)
VIX (volatility index)
VXX (iPath S&P 500 VIX Short-Term Futures ETN)
EWG (iShares MSCI Germany Index Fund)
CAT (Caterpillar).
Commentary
Suddenly, it has become MUCH easier to get bearish and stay bearish.
All seemed to be going well for another oversold bounce. The Australian dollar was on the rebound and seemed to verify important bottoms. (At the time of writing, the Australian dollar is making a fresh charge higher and given me renewed expectations for a bullish run in stocks). The S&P 500 did not gap up, but it at least opened in the green. Early selling pressure was erased in short order and led even to a new high of the day seemingly safely perched above 200DMA support. But in selling reminiscent of vicious bear markets, everything fell apart in the last hour of trading.


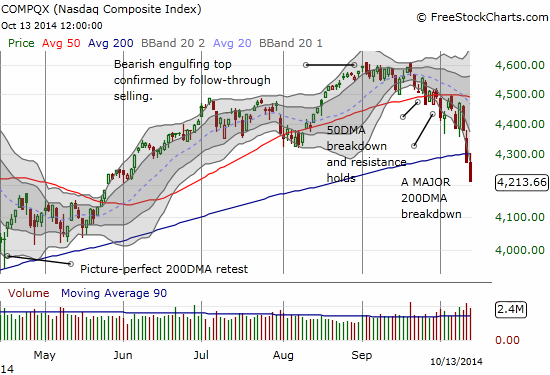
This is a VERY ugly and bearish picture. No oversold T2108 analysis can smooth this picture over! So now what? Now that the bears have fully taken a hold of the market, trading has become both trickier and more simple. Trickier because oversold bounces potentially have even less upside potential, and simpler because some definitive lines in the sand are drawn. And trickier again because surging volatility is increasing the odds that both bears and bulls will suffer serious whiplash for holding onto short-term trades too long. I will step through this case-by-case.
The T2108 oversold trade
T2108 is 13.5% and getting to rock bottom levels. It will get harder and harder for the market to push this number lower. T2107 confirms just how bad things are getting as the percentage of stocks trading above their 200DMAs fell further to 30%. Both T2107 and T2108 are at multi-year closing lows. The rule for aggressive traders is to initiate positions on a surge in volatility that breaks through previous highs (if volatility is already “very” high – coming with 25% of the previous high is sometimes good enough). The assumption is that such a break represents a blow-off top in fear. Unfortunately, fear still knows no bound right now.
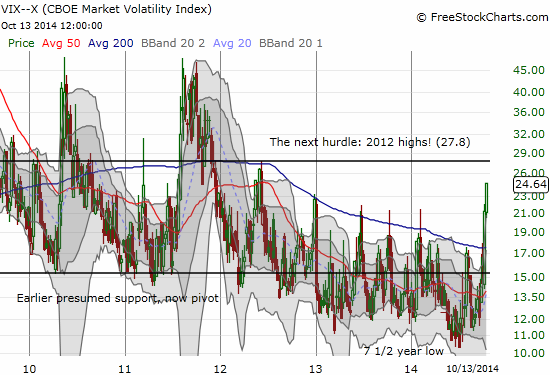
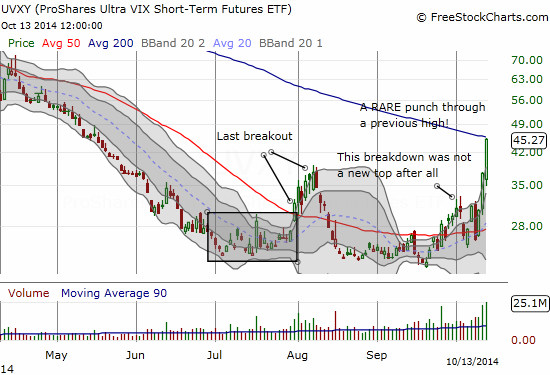
I am of course tempted to call an end to this rise given UVXY is at what SHOULD be stiff 200DMA resistance, but I have to remain circumspect given the major breakdowns underway for the indices.
Aggressive traders have now seen two lines in the sand melt away on the VIX and here is a third. I bought a fresh tranche of SSO calls but dialed back the position size dramatically. I am now considering keeping all further bullish trades on hold until a major PULLBACK in the VIX occurs. Stay tuned on this. No matter the rule, the best to expect out of a short-term oversold bounce is a retest of the 200DMA as resistance. I would prefer to get aggressive again the further away the market falls away from this line. Regular readers know the drill – I would LOVE to see a large gap down, huge spike in the VIX, and a steep plunge in T2108 for buying a large truckload of SSO call options.
The conservative “wait and see” trade
Conservative traders have happily stayed on the sidelines after getting churned following the previous two oversold periods. Here is where it finally pays to stay conservative and wait for the oversold period to end before going long. HOWEVER, the looming 200DMA resistance makes this approach even trickier since it is very possible that the next emergence from oversold conditions will happen right at 200DMA resistance. So, for now, conservative traders might as well wait until the S&P 500 (SPY) can reprove its mettle with a firm close (and follow-through buying) above 200DMA resistance.
The growling bear trade
Stubborn bears who have held through all the oversold churn are now hooting, howling, and growling in glee. The 200DMA breakdowns put them in the driver’s seat. The continuing spike in fear helps deliver up ever lower prices for their shorts. They also have no rush now to close out short positions since bulls are the ones on the ropes for once. Aggressive bears can now sit on ALL positions until the S&P 500 recovers above its 200DMA. They are in an even better position if they took SOME profits on the way down to provide cushion. I am still not a bear, so I released another short into the wild. This time it was Splunk (SPLK). Note this position grew larger as I added on a play for 200DMA resistance.
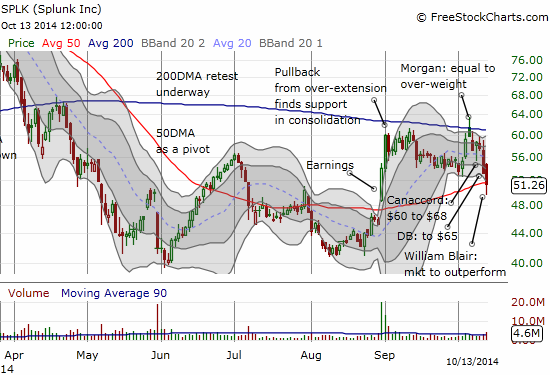
Like the bears, I see no rush to close out any other short positions, but I am at the point where I am pretty thin on (partial) hedges! Unlike the bears, I will NOT short fresh shares during oversold conditions. For SPLK, I took a sliver of the profits, bought a put option and offset with call options. I think fireworks are yet to come that could benefit either (both) sides of the trade. The technicals AND the valuations still work firmly against SPLNK. I will write more on this one later.
Conclusion
It seems so long ago when I noted the clock was ticking on selling pressure (it was just September 25th!). T2108’s extended stay below the 30% level has now turned the tables on the bulls. Not only is the 15-day duration of the 30% underperiod well above the median and average, it is also now in territory where the projected performance of the S&P 500 will head downward into negative territory linearly with time. The S&P 500 crossed below 30% on September 23rd with the S&P 500 closing at 1982.77. THAT seems like a mile away now!
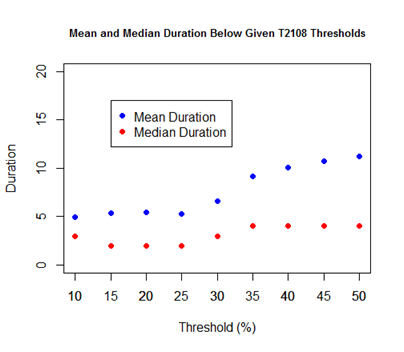
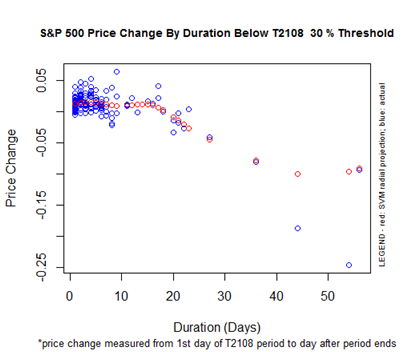
In other words, the short-term upside for an oversold bounce gets more and more limited the longer T2108 spends in low under-periods…another reason why even LOWER prices are now key to making oversold trades most worthwhile from a risk/reward perspective.
Be careful out there!
Daily T2108 vs the S&P 500
")
Black line: T2108 (measured on the right); Green line: S&P 500 (for comparative purposes)
Red line: T2108 Overbought (70%); Blue line: T2108 Oversold (20%)
Weekly T2108

*All charts created using freestockcharts.com unless otherwise stated
The T2108 Resource Page
Expanded daily chart of T2108 versus the S&P 500
Expanded weekly chart of T2108
Be careful out there!
Full disclosure: long SSO call options and shares, long UVXY puts, net short the Australian dollar, short FB