
(T2108 measures the percentage of stocks trading above their respective 40-day moving averages [DMAs]. It helps to identify extremes in market sentiment that are likely to reverse. To learn more about it, see my T2108 Resource Page. You can follow real-time T2108 commentary on twitter using the #T2108 hashtag. T2108-related trades and other trades are posted on twitter using the #120trade hashtag)
T2108 Status: 43.6%
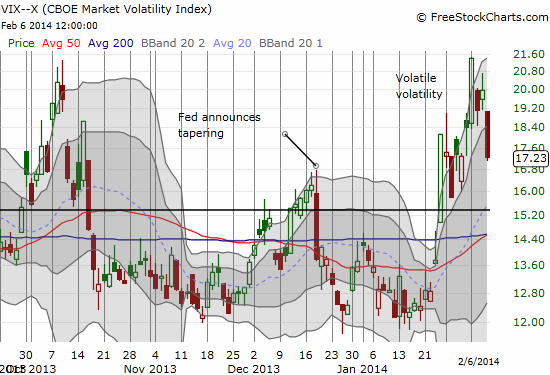
VIX Status: 17.2 (a 13.7% DEcrease!)
General (Short-term) Trading Call: Short (bearish bias) still with caveats (see below)
Active T2108 periods: Day #149 over 20%, Day #108 over 30%, Day #1 over 40% (overperiod), Day #5 under 50% (underperiod), Day #11 under 70%
Reference Charts (click for view of last 6 months from Stockcharts.com):
S&P 500 or SPY
SDS (ProShares UltraShort S&P500)
U.S. Dollar Index (volatility index)
EEM (iShares MSCI Emerging Markets)
VIX (volatility index)
VXX (iPath S&P 500 VIX Short-Term Futures ETN)
EWG (iShares MSCI Germany Index Fund)
CAT (Caterpillar).
Commentary
The week started on a very sour note but that is as far as bears could push their case. Now, signs are finally piling up on the side of the bulls, making a case for a (short-term?) bottom. As I explained in the last T2108 Update, my bearishness is “soft” in that I am looking to fade a rally while at the same time fade volatility as that rally unfolds. My assessment of a likely bottom from the last T2108 Update is a case in point:
“All the ingredients are in place for a bounce on Tuesday that could sustain itself for several days if not longer: a tremendous surge in the VIX suggesting a washout of sellers and fear, the S&P 500 well over-extended below its lower-Bollinger Band, T2107 at its apparent lows, and quasi-oversold conditions for T2108. While I suspected tonight’s T2108 Update would turn up bullish tidings, I did not dare replace my now worthless SSO call options with a fresh tranche. Strangely enough, a low-ball limit order for a fresh tranche of iPath S&P 500 VIX ST Futures ETN (VXX) puts did not execute. This lack of execution makes me suspect even more that a bounce is coming and volatility is finally peaking. We will see.”
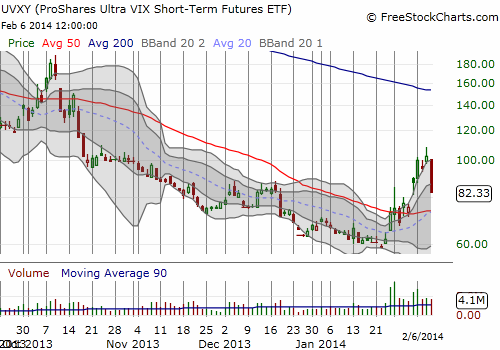
As it turned out, the VIX collapsed the very next day and collapsed even further today (Thursday, February 6, 2014). My bets against volatility – iPath S&P 500 VIX ST Futures ETN (VXX) and ProShares Ultra VIX Short-Term Futures ETF (UVXY) – are now essentially about flat now, and should be nicely profitable by sometime next week at the current pace of movement. I did manage to double down on the VXX puts as VXX and UVXY managed to rise higher even as the VIX had already peaked.
The S&P 500 (SPY) rallied so strongly today that it tore right through what I thought would be the next resistance level, the post-taper low. The good side of today’s move is that it did not even give me a chance to fade the index with fresh SSO puts. Now I have no choice but to look for a rally into 1800 and/or the 50-day moving average (DMA). Both levels are pretty close to the declining 20DMA.
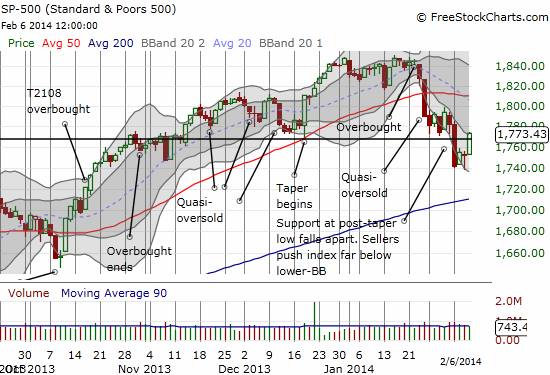
The rally of course sent T2108 popping as well. It is starting to look like yesterday’s low around 35% will be the low for this cycle – no oversold buying yet! Here is what I tweeted in the morning before the rally really took off.
%stocks>40DMA creeping upward. At 41% now. May have already seen low for this cycle. #T2108 $SPY
— Data-driven $$$ (@DrDuru) February 6, 2014
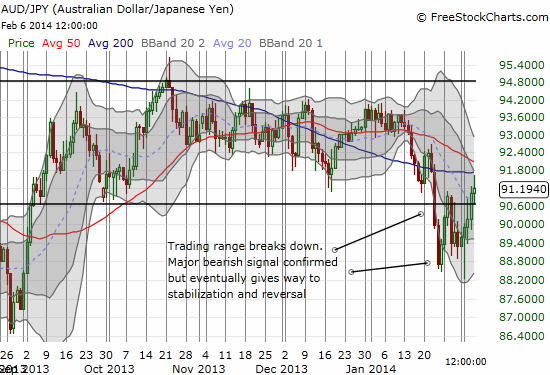
Here is a check in on my favorite currency related indicator, the Australian dollar (FXA) versus the Japanese yen (FXY): AUD/JPY. Notice how the currency pair has already begun to stabilize after the three-day plunge in late January. AUD/JPY has now erased about half those losses.
As an extra bonus, the Turkish lira has also stabilized against the U.S. dollar. My strategy to fade the rally in USD/TRY after the central bank sent interest rates soaring is now paying off. I was tempted to take the trade off ahead of the jobs report, but decided to hang in there since I had seen this play as one to last at least a few months. Unfortunately, I missed a great chance at a quick 10% gain off the bottom in iShares MSCI Turkey (TUR).
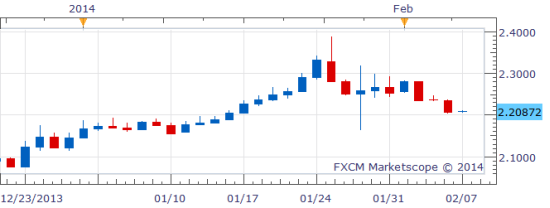
Source: Dailyfx.com
All these signs and indicators add up to bullish tidings ahead of tomorrow’s jobs report for January. I hope expectations are low because severe weather in January must have really suppressed normal (Winter) hiring. In fact, I suspect that whatever negative response the market may have, buyers will quickly step in to pick up the pieces. I will likely be one of them!
I conclude with some important updates and stock charts.
First, note that I reshorted LinkedIn (LNKD) ahead of tonight’s earnings. It turned out that “something” was definitely up with the stock as indicated by the wild gyrations in the weeks heading into earnings. This wildness was punctuated with another sharp rally that took the stock up 4.2% on the day and right through 200DMA resistance once again. I will do a chart update after we see what happens post-earnings tomorrow. I already covered my short in the after hours once the stock punched through $200. This level coincided with the low of 2014, AND it was below the lower-Bollinger Band. I did not want to take my chances at watching the stock race higher in pre-market after the jobs report or after the open.
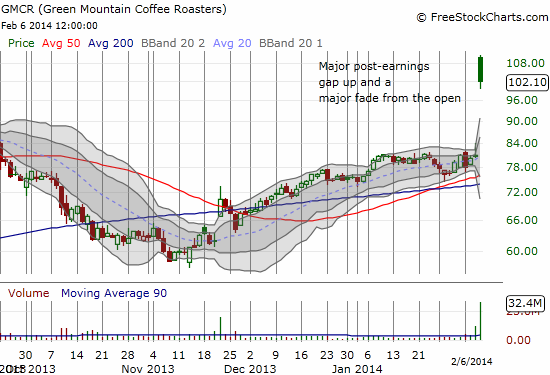
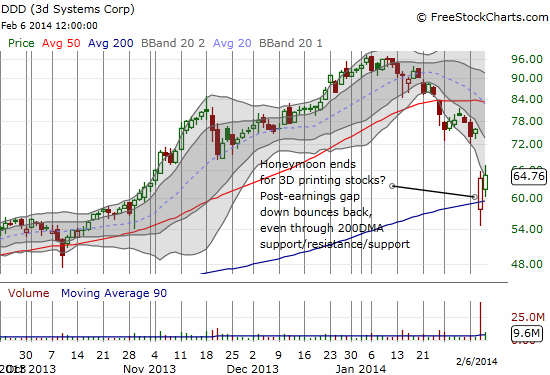
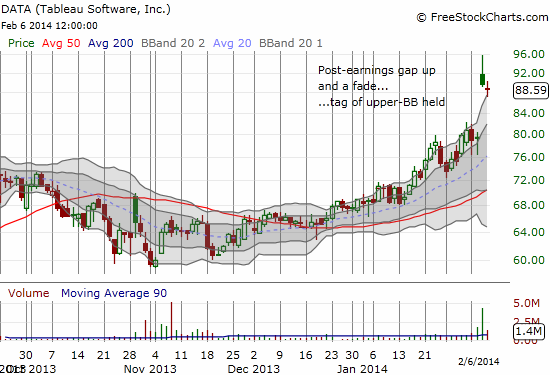
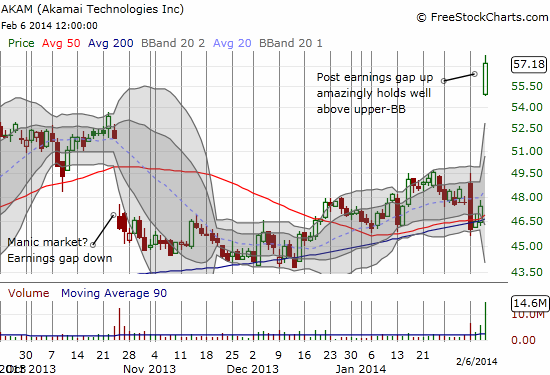
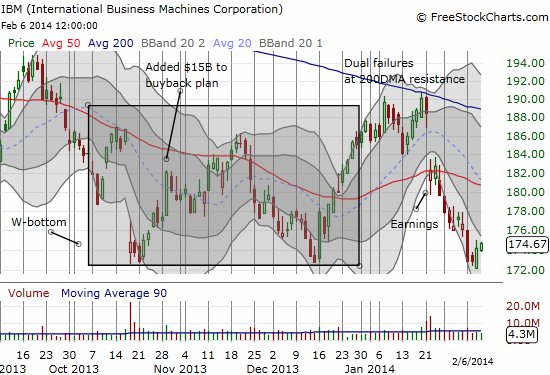
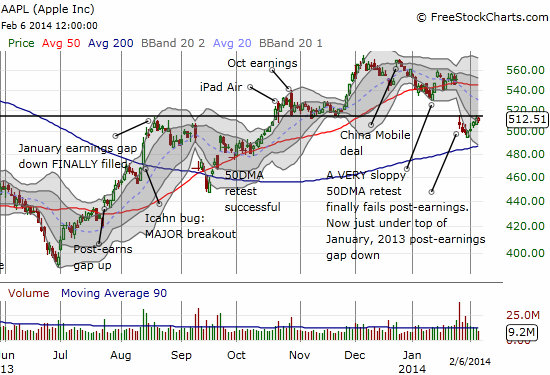
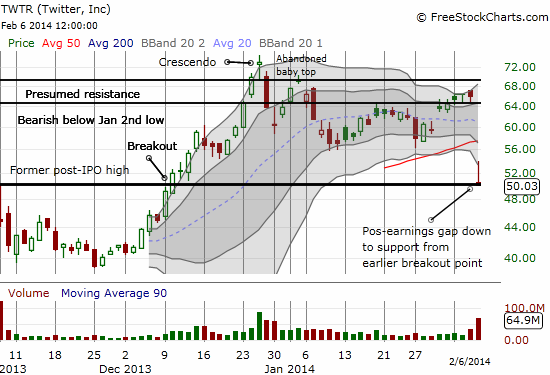
Speaking of Bollinger Bands (BBs), I have three instructive stocks, all post-earnings, that once again demonstrate the power of fading moves outside of the BB: Green Mountain Coffee Roasters (GMCR), Tableau Software (DATA), and 3d Printing Systems (DDD). I could not trade GMCR because shares to short were not available to me in after hours trading. I forgot about DATA. But I DID nail DDD. I also finally found an exception in Akami (AKAM) which I managed to avoid shorting. Twitter (TWTR) presents a different case where the lower-BB failed to hold, but I think it was for a VERY good reason. I include a look at the bounce in International Business Machines (IBM) – as promised, I bought calls on a retest of the bottom – and Apple (AAPL) where my Apple Trading Model (ATM) turned very bearish this week at the wrong time…now I know the failures have occurred because Tim Cook and company have accelerated share repurchases (I shoulda known)!
The Apple Trading Model (ATM) turned very bearish for this week. This turn happened to coincide with a rally. Very frustrating of course! I updated the model with the latest data and found some small solace to see that even the latest data would have supported this week’s trading. Click here for the updated regression trees for the different years and predictions for performance relative to the last close and the last open.
Finally, Twitter (TWTR). I happened to write about TWTR reaching a crescendo right at the top. Ever since then, TWTR has traded very neatly between and around key technical levels of resistance and support. Even the post-earnings gap down behaved by settling in around $50 which happens to be the previous post-IPO high and breakout point. The surprising point is that after closing the gap with the lower-BB, as expected, TWTR faded right back to support. I successfully played the first bounce and dared to buy right back in again on the fallback. I am still holding a Feb $57.50/50 put spread that I bought earlier assuming $50 would be the bottom of the next downward swoon for the stock. I will write in more detail on TWTR’s earnings and trading in a future post.
Daily T2108 vs the S&P 500
")
Black line: T2108 (measured on the right); Green line: S&P 500 (for comparative purposes)
Red line: T2108 Overbought (70%); Blue line: T2108 Oversold (20%)
Weekly T2108

*All charts created using freestockcharts.com unless otherwise stated
Related links:
The T2108 Resource Page
Expanded daily chart of T2108 versus the S&P 500
Expanded weekly chart of T2108
Be careful out there!
Full disclosure: long SPHB and SPLV and SSO puts; long VXX shares and puts; long UVXY puts; long AAPL shares and puts, long IBM calls, long TWTR shares and put spread