
(T2108 measures the percentage of stocks trading above their respective 40-day moving averages [DMAs]. It helps to identify extremes in market sentiment that are likely to reverse. To learn more about it, see my T2108 Resource Page. You can follow real-time T2108 commentary on twitter using the #T2108 hashtag. T2108-related trades and other trades are posted on twitter using the #120trade hashtag)
T2108 Status: 37.0%
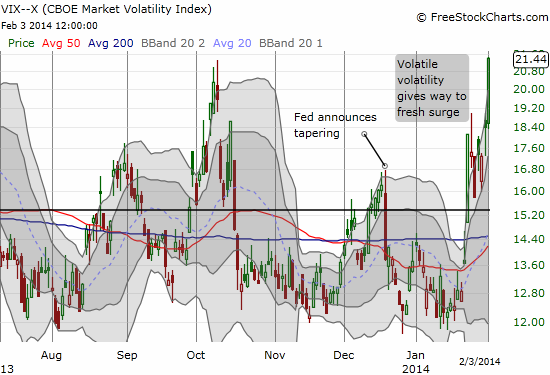
VIX Status: 21.4 (a 16.5% increase!)
General (Short-term) Trading Call: Short (bearish bias) still with caveats (see below)
Active T2108 periods: Day #146 over 20%, Day #105 over 30% (overperiod, 30-days 40% overperiod ended), Day #1 under 40% (underperiod), Day #8 under 70%
Reference Charts (click for view of last 6 months from Stockcharts.com):
S&P 500 or SPY
SDS (ProShares UltraShort S&P500)
U.S. Dollar Index (volatility index)
EEM (iShares MSCI Emerging Markets)
VIX (volatility index)
VXX (iPath S&P 500 VIX Short-Term Futures ETN)
EWG (iShares MSCI Germany Index Fund)
CAT (Caterpillar).
Commentary
In the last T2108 Update, I gave this list of “keys to watch”:
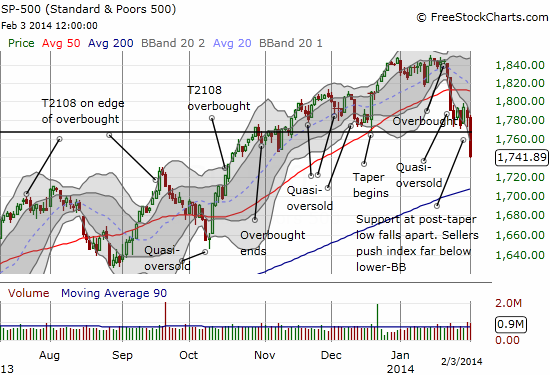
- The post-taper low: a close below this apparently critical support will be very bearish.
- The VIX: it is proving surprisingly resilient and raising my alarm bells for a a steep slide ahead.
- Speculative stocks: it is hard to imagine a steep decline starting in the market without more of the typical speculative and momentum stocks tumbling as well (see special note on Amazon.com below).
- Currency market: Traders are watching currencies more closely and reacting more quickly. My favorite tell remains AUD/JPY – the Australian dollar (FXA) versus the Japanese yen (FXY).
I followed that list by stating:
“My fundamental bias remains bearish, but it is a ‘soft’ bearishness that tells me to fade the market on a relief rally into overhead 50DMA resistance. I am NOT bearish because I expect the critical post-taper support to give way imminently. I am waiting to see the market’s behavior after a bounce.”
Clearly, I was NOT nearly bearish enough!
The alarm bells from rising volatility reached a deafening pitch today as the VIX soared 16.5% to 21.4, and the S&P 500 (SPY) crashed through post-taper support with a tremendous 2.3% loss. T2108 also came tumbling down to 37%, losing a whopping 11 percentage points in the process.

Although T2108 barely budged on Friday, today’s plunge easily qualifies my favorite indicator for a quasi-oversold reading. The T2108 trading model produces 64% odds of a bounce in the S&P 500 for Tuesday. This bounce would be VERY consistent with the S&P 500’s previous tendencies to lose ground on Mondays and bounce on Tuesdays. Today’s plunge is out of character for the first trading day of the month. Anyway, the activated branch of the model triggers from a change in the VIX less than 21.3% and at least 15.9%, T2108 at least 12.3% and lower than 38.3%, and T2108 2-day change at least -51.7% (quite an extreme!). If T2108 had simply closed above 38.3% (and below 42.0%) with the VIX change above 5.3%, the odds of a bounce on Tuesday would have gone to 100%. So the model’s instability here at least reinforces the expectation of upside.
At times like these, I immediately dig up T2107, the percentage of stocks trading above their 200DMAs. Lo and behold, T2107 hit a 14+ month closing low! It just missed the intraday low from June, 2013.
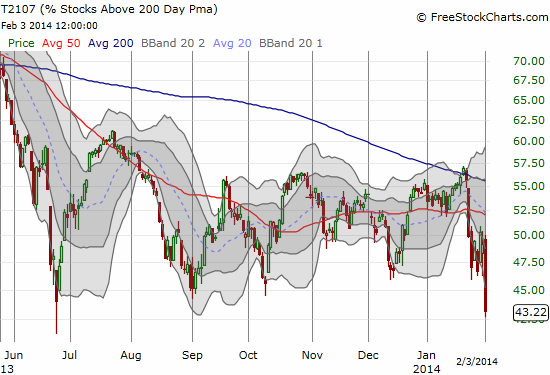
All the ingredients are in place for a bounce on Tuesday that could sustain itself for several days if not longer: a tremendous surge in the VIX suggesting a washout of sellers and fear, the S&P 500 well over-extended below its lower-Bollinger Band, T2107 at its apparent lows, and quasi-oversold conditions for T2108. While I suspected tonight’s T2108 Update would turn up bullish tidings, I did not dare replace my now worthless SSO call options with a fresh tranche. Strangely enough, a low-ball limit order for a fresh tranche of iPath S&P 500 VIX ST Futures ETN (VXX) puts did not execute. This lack of execution makes me suspect even more that a bounce is coming and volatility is finally peaking. We will see.
Three important lessons for this latest cycle: 1) a rapid and steep pullback from overbought conditions is indeed a strong warning sign, 2) a stubborn VIX IS a likely sign of imminent selling, and 3) finessing the trading bias is too complicated. In other words, on #3, instead of waiting for a bounce to fade to get aggressively bearish, I should have just focused on bearish set-ups in individual stocks offering good risk/reward characteristics. Now, it is “too late” to get aggressive as the risk/reward strongly favors buyers here. The next fade attempt might be a retest of taper support turned resistance. If the S&P 500 gaps down on Tuesday, that event would be a near automatic buy signal – especially if T2108 manages to go below 30% or, even better, hits oversold. I will NOT chase a gap higher.
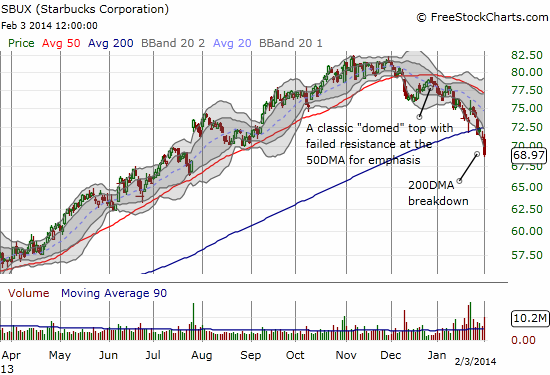
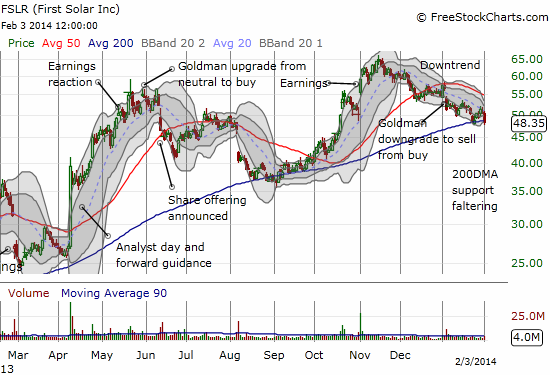
I conclude with two interesting charts: Starbucks (SBUX) and First Solar (FSLR). These are the kinds of setups I should have focused on earlier with my bearish bias instead of fading a bounce on the S&P 500.
I traded in and out SBUX on the short side thanks to Doug Kass tweeting about SBUX breaking $70. It reminded me that SBUX had broken down below its 200DMA: a bright red trigger to go short on an ugly day like this. I closed out the trade after a point, not wanting to hold this kind of short overnight. However, SBUX stays on the short list until it manages to close above its 200DMA again. Even then, the current stock pattern looks like a classic top in the making and the downtrend from recent highs will be intact.
First Solar (FSLR) has been on a downtrend since November’s two-year high. It is now struggling to hold 200DMA support and closed just below it today. I do not think this support will hold given the weight of the current downtrend and a 50DMA that is closing down fast. I have just one put option as a speculation play that a bigger breakdown is imminent.
Daily T2108 vs the S&P 500
")
Black line: T2108 (measured on the right); Green line: S&P 500 (for comparative purposes)
Red line: T2108 Overbought (70%); Blue line: T2108 Oversold (20%)
Weekly T2108

*All charts created using freestockcharts.com unless otherwise stated
Related links:
The T2108 Resource Page
Expanded daily chart of T2108 versus the S&P 500
Expanded weekly chart of T2108
Be careful out there!
Full disclosure: long SPHB and SPLV and SSO puts; long VXX shares and puts; long AUD/JPY; long FSLR put