
(T2108 measures the percentage of stocks trading above their respective 40-day moving averages [DMAs]. It helps to identify extremes in market sentiment that are likely to reverse. To learn more about it, see my T2108 Resource Page. You can follow real-time T2108 commentary on twitter using the #T2108 hashtag. T2108-related trades and other trades are posted on twitter using the #120trade hashtag)
T2108 Status: 56.1%
VIX Status: 12.3
General (Short-term) Trading Call: Aggressive traders should stop out of S&P 500 shorts. Next opp either overbought status and/or a fresh close under 1800.
Active T2108 periods: Day #104 over 20% (overperiod), Day #12 under 60%, Day #17 under 70%
Reference Charts (click for view of last 6 months from Stockcharts.com):
S&P 500 or SPY
SDS (ProShares UltraShort S&P500)
U.S. Dollar Index (volatility index)
EEM (iShares MSCI Emerging Markets)
VIX (volatility index)
VXX (iPath S&P 500 VIX Short-Term Futures ETN)
EWG (iShares MSCI Germany Index Fund)
CAT (Caterpillar)
Commentary
Yes, the S&P 500’s trend is still up. For the first time in the history of the universe, the S&P 500 (SPY) closed above 1800.
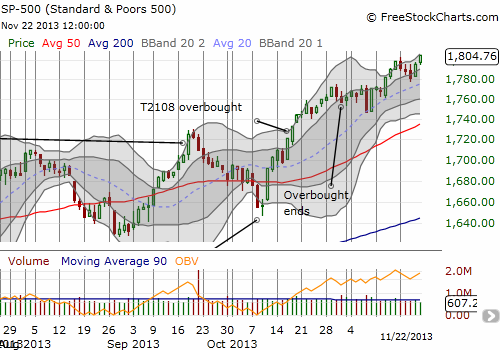
This is where aggressive traders should stop out of (S&P 500) shorts and rev up trend-following strategies. I will be dumping my ProShares UltraShort S&P500 (SDS) shares next week but letting ride my very small tranche of puts on ProShares Ultra S&P500 (SSO) as is my typical approach for the options. It does not make sense to get short again until either T2108 goes overbought and/or the S&P 500 closes below 1800. The latter round number rule comes from at least a year of pivots around round numbers; since at least 1400 (I need to do a more extended study!), the S&P 500 has experienced follow-through selling whenever it has managed to close below one of these round numbers. Obviously, these have been temporary opportunities given the current location at all-time highs.
The T2108 Trading Model (TTM) delivered again by identifying quasi-oversold conditions that resolved into this resumption of the S&P 500’s strong upward push. I discussed the projection in the last T2108 Update. All the evidence since I formalized the concept of quasi-oversold demonstrates that is a very tradeable setup. I fully recognize a lot of the power of quasi-oversold comes from being in a bull market uptrend, so the next test will come whenever the index goes into a real slump…whenever THAT happens! But be reassured that I am using data going back to 1986 for this model, so I think it is relatively robust for many different conditions. As always, time will tell!
Daily T2108 vs the S&P 500
")
Black line: T2108 (measured on the right); Green line: S&P 500 (for comparative purposes)
Red line: T2108 Overbought (70%); Blue line: T2108 Oversold (20%)
Weekly T2108

*All charts created using freestockcharts.com unless otherwise stated
Related links:
The T2108 Resource Page
Expanded daily chart of T2108 versus the S&P 500
Expanded weekly chart of T2108
Be careful out there!
Full disclosure: long SSO puts, SDS shares