
(T2108 measures the percentage of stocks trading above their respective 40-day moving averages [DMAs]. It helps to identify extremes in market sentiment that are likely to reverse. To learn more about it, see my T2108 Resource Page. You can follow real-time T2108 commentary on twitter using the #T2108 hashtag. T2108-related trades and other trades are posted on twitter using the #120trade hashtag)
T2108 Status: 56.7%
VIX Status: 13.1
General (Short-term) Trading Call: Aggressive traders should stay short. Stop out on S&P 500 follow-through above 1800. Also see below for notes on Black Friday.
Active T2108 periods: Day #100 over 20% (overperiod), Day #8 under 60% (underperiod), Day #13 under 70%
Reference Charts (click for view of last 6 months from Stockcharts.com):
S&P 500 or SPY
SDS (ProShares UltraShort S&P500)
U.S. Dollar Index (volatility index)
EEM (iShares MSCI Emerging Markets)
VIX (volatility index)
VXX (iPath S&P 500 VIX Short-Term Futures ETN)
EWG (iShares MSCI Germany Index Fund)
CAT (Caterpillar)
Commentary
The S&P 500 stopped short of triggering the condition that ends my latest attempt to play the T2108 trade from the bearish side as explained in the last T2108 Update. The index hit an all-time intraday high of 1802 before pulling back for a fractional close on the day. Shorts should end with the S&P 500 closing above 1800 for two days in a row. (The first close is the warning. The second close higher is the confirmation).
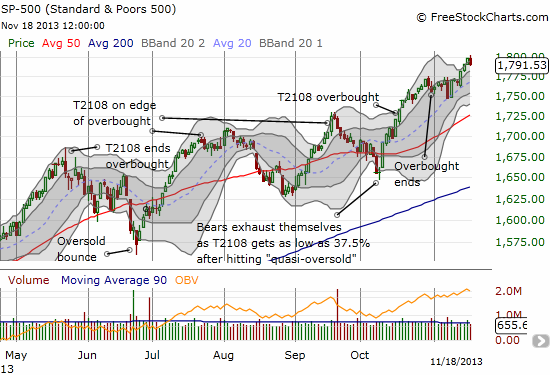
The loss on the day was very mild, but the VIX soared 7.5%. I strongly suspect this was a result of the large number of speculative, high-flying, and similar kinds of momentum stocks that got slammed on the day, especially in technology and even more so in internet/cloud/social networking stocks. I was surprised that this selling did not ding the indices more but the NASDAQ did manage to lose 0.9%. I was tempted to add a second tranche of SSO puts based on this weakness but decided against it. I will only add (or start fresh) once/if T2108 flips to overbought again.
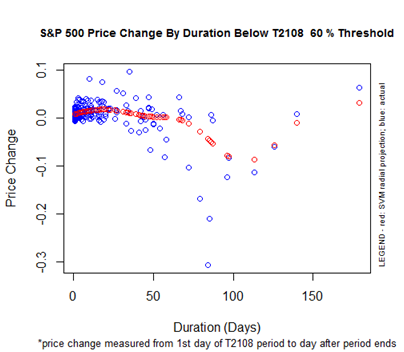
In the meantime, the indices technically have more room to grow on the upside with T2108 still below 60%. HOWEVER, the S&P 500 is now up a surprising 2.5% even after T2108 has traded 8 days under 60%. The chart below shows that this performance is toward the high end of the range that we should expect once/if T2108 cross above 60% again.
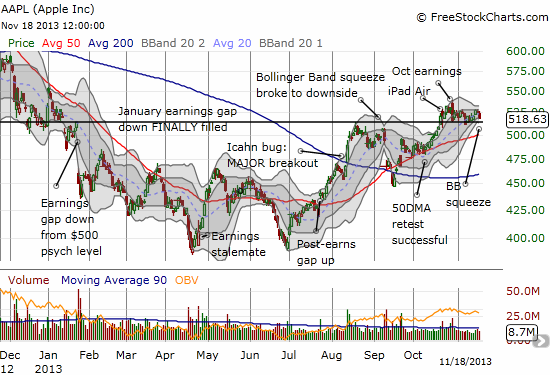
There are some very dramatic examples of the selling that happened Monday. While the general market seems content to ignore it. I do not think we should, especially some of these stocks hit important technical levels. I mention these in the labels on the charts. Facebook (FB) fell 6.5%. Zillow (Z) fell 4.9%. Tesla (TSLA) fell 10.2%. Apple (AAPL) was the lightweight with a 1.2% but it is forming an ominous Bollinger Band squeeze…
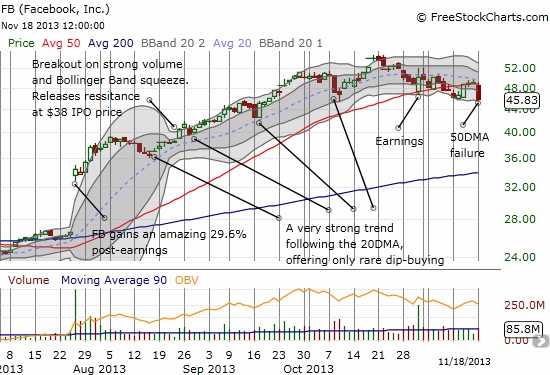
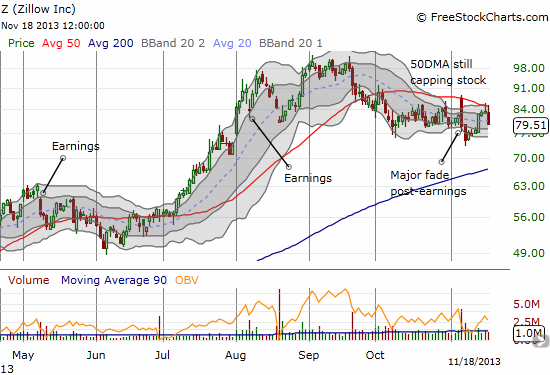
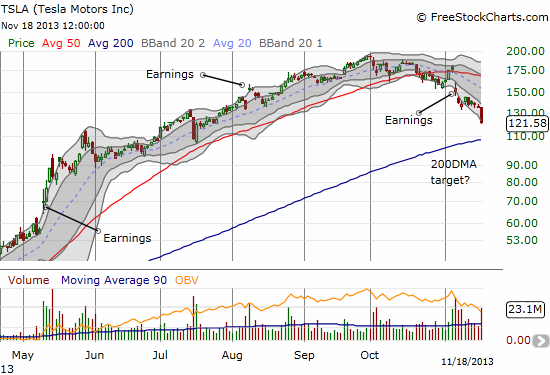
These charts are just hints of what looks like natural profit-taking after an incredible year in so many momentum stocks. I was thinking sellers would wait until January in order to push out the tax consequences. Perhaps they agree that the technical signs suggest that now is the time to get out while the getting is good. One special note on Tesla (TSLA): While I fully recognize the current short-term downtrend, I have also been dying to get in at cheaper prices. I took advantage of the deep 10% plunge to sell my puts and turn around and buy shares and a few speculative calls.
As momentum potentially shifts from buyers to sellers in tech stocks and other speculative names, Black Friday looms right over the horizon. I studied the importance of this season last year in a piece titled “Quantifying the Significance of Black Friday Trading.” This piece came on the heels of the 6th best Black Friday performance on the S&P 500 since 1950. My analysis found several important things:
- A tendency for the S&P 500 to trade up on Black Friday.
- 2012’s large Black Friday gains broke the longest losing streak of Black Fridays since 1950 (3 years in a row of down Black Fridays)
- A slight tendency for the Monday following Black Friday to close down.
- IF the S&P 500 manages to close higher on the following Monday, then odds are very high that the index will not look back for weeks and maybe months.
- Special recognition goes to 1951, 1988, 1991, 2011, and NOW 2012 as years featuring Black Fridays where the S&P 500 never closed below the close of Black Friday.
So if Black Friday can be such a bright beacon for bulls, why do I call this 2013’s last stand for bears? Basically, if bears fail to push the S&P 500 below Black Friday’s close, whether it is an up or down day, in the following week, they can pretty much kiss 2013 goodbye….and 2014 could be rough as well. As always, I will take this one step at a time. For now, I am monitoring closely the momo stocks for further profit-taking and preparing for some Black Friday shopping…in the stock market.
By the way, December tends to be a very mild month as far as drawdowns go. Since 1950 the median of all maximum losses in December is -1.0%. This is the best of ALL months, closely followed by March and November each at -1.1%. The average maximum loss for the month of December is -1.6%. Again, the best showing of any month of the year. More details to come in a future post (I spent too much time trying to recover as much of a week of work as I could thanks to a server failure at my hosting company. Lightning has struck my blog TWICE this year now!)
Daily T2108 vs the S&P 500
")
Black line: T2108 (measured on the right); Green line: S&P 500 (for comparative purposes)
Red line: T2108 Overbought (70%); Blue line: T2108 Oversold (20%)
Weekly T2108

*All charts created using freestockcharts.com unless otherwise stated
Related links:
The T2108 Resource Page
Expanded daily chart of T2108 versus the S&P 500
Expanded weekly chart of T2108
Be careful out there!
Full disclosure: long SSO puts; long TSLA shares and calls; short FB, long FB calls; short Z, long Z calls; long AAPL shares; long AAPL puts, calls, and put spread;