
(T2108 measures the percentage of stocks trading above their respective 40-day moving averages [DMAs]. It helps to identify extremes in market sentiment that are likely to reverse. To learn more about it, see my T2108 Resource Page. You can follow real-time T2108 commentary on twitter using the #T2108 hashtag. T2108-related trades and other trades are posted on twitter using the #120trade hashtag)
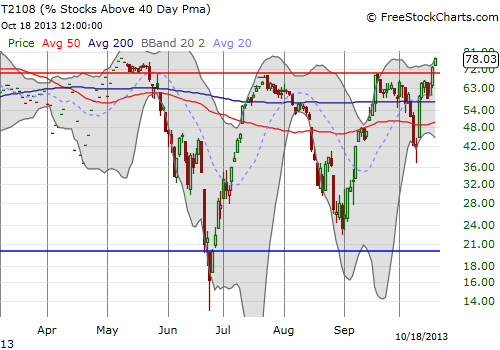
T2108 Status: 78.0% (Day #2 overbought)
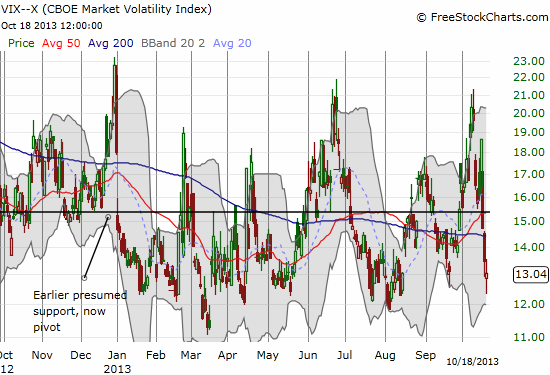
VIX Status: 13.0 (close to multi-year lows)
General (Short-term) Trading Call: Hold. Short if T2108 quickly drops from overbought status and/or closes below Friday’s low.
Active T2108 periods: Day #79 over 20% (overperiod), Day #2 over 70% (ended 102 days under 70%)
Reference Charts (click for view of last 6 months from Stockcharts.com):
S&P 500 or SPY
SDS (ProShares UltraShort S&P500)
U.S. Dollar Index (volatility index)
EEM (iShares MSCI Emerging Markets)
VIX (volatility index)
VXX (iPath S&P 500 VIX Short-Term Futures ETN)
EWG (iShares MSCI Germany Index Fund)
CAT (Caterpillar)
Commentary
My last T2108 Update was two weeks ago. During that time I missed two key turning points as the fiscal fiddling played on and on.
On October 8, 2013, T2108 closed at 42.0%, a 30% drop in two days. That kind of drop qualified as a quasi-oversold condition. The one-day drop was 19.1%. The VIX gained 4.8% to close at a peak for the cycle and a 3-month high. However, this move on the VIX was not large enough to generate a high-probability prediction for the S&P 500’s next move. The T2108 Trading Model (TTM) predicted only a 53% chance of an up day. I would not have executed a trade, but I would have been on alert for a trade. Indeed, after the close that day I tweeted: “Oversold coming before debt doomsday? %stocks>40DMA=41.8. down from 60.4. #T2108 $$”. I got the T2108 info thanks to the help of a friend, but at the time it did not occur to me to check the 2-day change on T2108. So, I completely missed the clue when the next day T2108 dropped as low as 37.5% before the S&P 500 (SPY) bounced back from an over-stretched condition below the lower-Bollinger Band. The market has barely looked back since then.
If I had not traded the dip below the the lower-BB, I sure would have on the next day. The surge on October 10th essentially confirmed a bottom from the hammer-like pattern, especially since it included a large jump over the 50DMA. Ironically enough, I was alert enough to buy puts on iPath S&P 500 VIX ST Futures ETN (VXX) and loaded up on Facebook (FB) call options (I will save the FB story for another time – I have a LOT of catch-up to do!). I sold the VXX puts for a nice gain the very next day and of course I wish I STILL held them. The volatility index (VIX) has now plunged toward multi-year lows again.
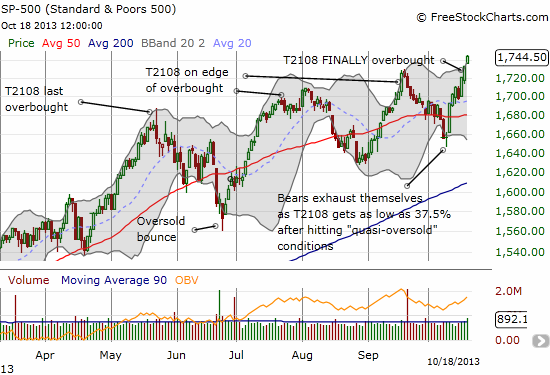
The second event I missed happened just yesterday, so I am right on time to act more directly and with purpose. On Thursday (October 17th), T2108 finally cracked the overbought barrier by closing at 73.4%. It was a breakout in every sense: it reached a 5-month high, broke through 70% which had proved to be tough resistance twice earlier (June and September), and ended four trading days of consolidation just under resistance (see the chart above).
As T2108 followers should know by now, I no longer consider overbought conditions to be an automatic trigger to go bearish. Since overbought conditions can extend into powerful rallies, I have learned NOT to chase shorts upward. I either look for an excuse to hop on the train (albeit late) or wait patiently wait for convincing evidence from the bearish tea leaves. That evidence may already be on the horizon. As shown above, the S&P 500 is now solidly stretched over the upper-BB, almost a mirror image of the stretch below the lower-BB just a week and a half ago. In fact, making such a trip from outside the BB boundaries in such a short time represents an incredible journey just asking for a pullback. Moreover, the VIX is scratching at support near multi-year lows…it is a near certainty that the VIX will eventually bounce from these levels, taking the S&P 500 down with it (at least for a short spell).
At this point, shorts do not make sense until the S&P 500 delivers an important lower close. For next week, the market could deliver two possible triggers:
- A close below Friday’s low. A bearish engulfing or even abandoned baby top pattern would be ideal.
- A drop from overbought conditions.
In each case, natural stops reside with either a new all-time high and/or a return to overbought conditions.
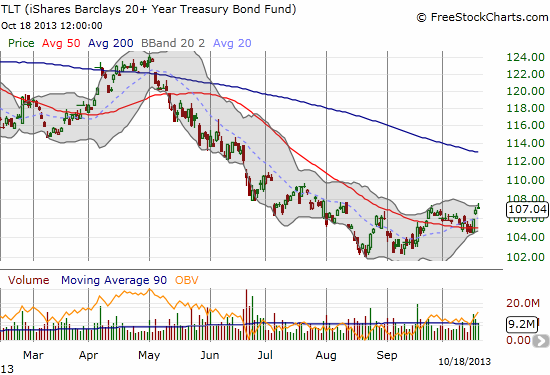
My BIG caution in trying to fade this move is that the market remains in a very bullish pattern. Last week’s bottom has all the hallmarks of bears and sellers exhausting themselves. With fiscal fiddling resolved for now, the bears simply have little ammunition left. Add on top of their woes the prospects of easy money in the form of delayed bond tapering into perhaps 2014 thanks to the perceived weakening of the economy from fiscal fiddling. Just look at the budding rally in government bonds (lower rates) and an ever sinking dollar. In the case of the U.S. dollar, it is now directly testing presumed support from its QE3 reference price.
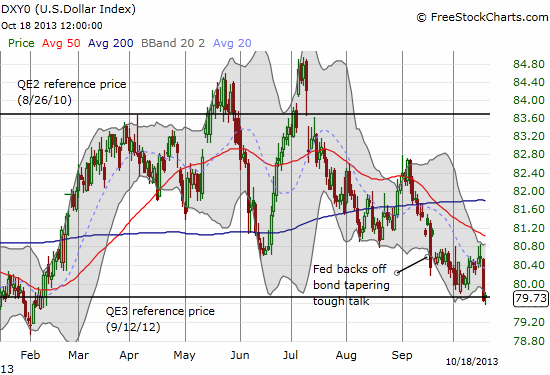
In other words, do not expect shorts to provide lasting trades. Buy the dips remains the operative phrase here.
Finally, let’s review T2108’s performance between overbought periods. This period lasted 102 days. The S&P 500 managed to deliver a GAIN of 4.7% over these five months. Quite an incredible performance. As a reminder, here is the chart of performance for the T2108 70% underperiod. Note that around 100 days, there is an extremely wide variation in performance with an expected performance near 0%.
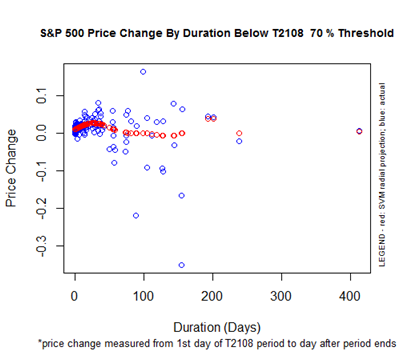
There was no way to predict this endpoint, but I was able to successfully use this chart to navigate the upside and downside possibilities along the way. Here is the potential the lies ahead for the 70% overperiod…
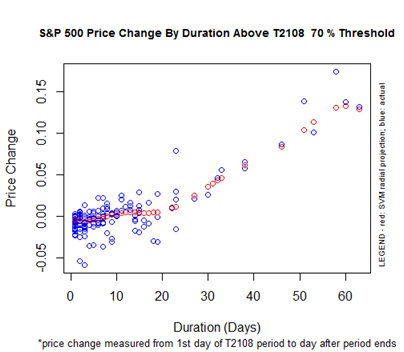
Remember that the 20-day point marks a major turning point where an extended overbought rally can really take-off.
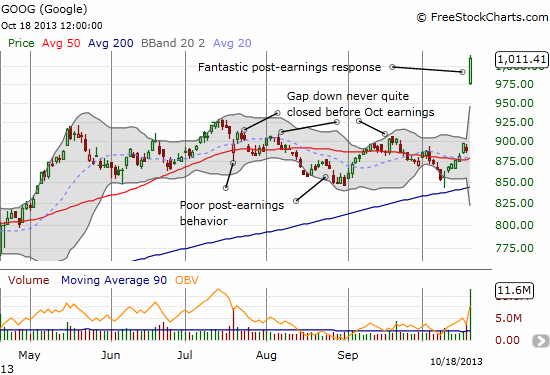
Finally, for my biggest miss of all. Google (GOOG) finally surpassed the $1000 mark in grand style with a 13.8% post-earnings pop. Breaking the $1000 barrier was something I anticipated several months back and tried several trades in anticipation. I gave up the dream as the stock followed through on post-earnings weakness in August. These post-earnings gyrations are a great reminder of how little the market truly understands about a company’s business from quarter-to-quarter. Also note that the same nice bottoming that the S&P 500 delivered last week was an even more powerful bottom for GOOG. Wish I had been there for the ride…!
Daily T2108 vs the S&P 500
")
Black line: T2108 (measured on the right); Green line: S&P 500 (for comparative purposes)
Red line: T2108 Overbought (70%); Blue line: T2108 Oversold (20%)
Weekly T2108

*All charts created using freestockcharts.com unless otherwise stated
Related links:
The T2108 Resource Page
Expanded daily chart of T2108 versus the S&P 500
Expanded weekly chart of T2108
Be careful out there!
Full disclosure: long VXX, short FB, net long U.S. dollar
Any thoughts on google for next week?
It is hard to imagine at this point that GOOG will press much higher without some consolidation. It is trading well above the upper-Bollinger Band (2 standard deviations). I think a retest of $1000 is in the cards before significant buying power presses the stock ever higher. Even if I am wrong in the short-term, chasing Friday’s move is a low reward/high risk shot!