
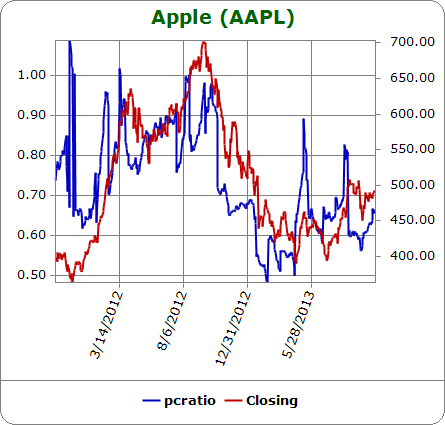
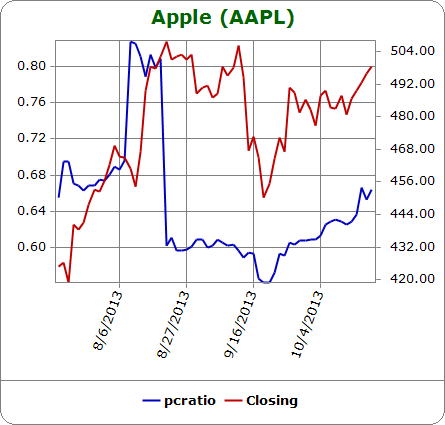
In previous Apple chart reviews and updates, I have noted the apparent influence of the open interest put/call ratio on the overall bull/bear tone of Apple (AAPL). When the stock last bottomed – between September 16th and 17th – the open interest put/call ratio dropped to a level last seen since, you guessed it, AAPL’s low for 2013 (and a 15-month low at the time) in mid-April just ahead of earnings. Going into that climactic low, AAPL’s open interest put/call ratio hit a series of major lows. Increases in this ratio off those lows have invariably accompanied rallies and recoveries in AAPL’s stock. The same thing is happening now. The charts below are from Schaeffer’s Investment Research; they show the maximum available data (the last two years) and a close up of recent months so that the current trend and correlation is more visible.
The stock chart is also looking quite bullish with the 50-day moving average (DMA) providing firm support since the recent extended retest. The 20DMA is now providing uptrending support as well. The stock is now up 8 days straight as it nears another retest of resistance from the top of the January earnings vicious gap down. I think the second time will be a charm.
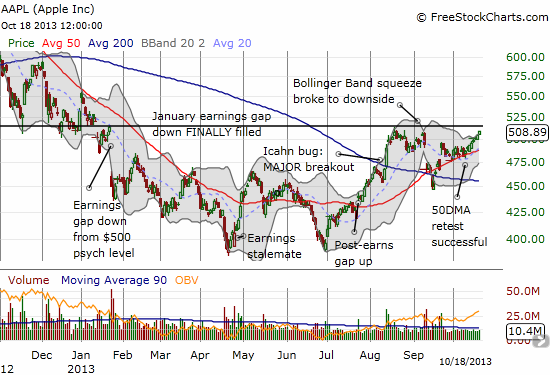
Source: FreeStockCharts.com
As I prepare for October’s earnings on the 28th of the month, I will be updating the Apple Trading Model (ATM) more frequently in preparation for an update of the earnings trading model. In the latest revision, I have added a trending component that determines whether the number of up days in the last 5 trading days has any bearing on the prediction for the next day of trading. In the model this is called “AAPLPrev5Days.” For a review of the Apple Trading Model see “ATM: The Apple Trading Model Refined.”
The prediction for Monday’s trading is a 91% chance of an up day. Note well that the model does not incorporate any notions of oversold or overbought. On the stochastics (not shown in the above chart for space reasons – click here for a view in StockCharts.com), AAPL is well-overbought. So, the technicals are a major caveat to the Monday prediction! Also as a reminder, the 2013 model remains the most reliable. I use the models with extra trading data as checkpoints. The more the models agree, the more confident I am in the prediction. For Monday, all 4 models agree and all with high odds.
The regression tress (classification) are posted on Google drive for each set of historical data: 2010, 2011, 2012, and 2013.
Be careful out there!
Full disclosure: long AAPL shares