
(T2108 measures the percentage of stocks trading above their respective 40-day moving averages [DMAs]. It helps to identify extremes in market sentiment that are highly likely to reverse. To learn more about it, see my T2108 Resource Page. You can follow real-time T2108 commentary on twitter using the #T2108 hashtag. T2108-related trades and other trades are posted on twitter using the #120trade hashtag)
T2108 Status: 60.0%
VIX Status: 13.8
General (Short-term) Trading Call: Hold – Aggressive traders who got long the breakout can STILL stay long; otherwise, buy dips with tight stops
Active T2108 periods: Day #15 over 20% (overperiod), Day #1 over 60%, Day #42 under 70%
Reference Charts (click for view of last 6 months from Stockcharts.com):
S&P 500 or SPY
SDS (ProShares UltraShort S&P500)
U.S. Dollar Index (volatility index)
VIX (volatility index)
VXX (iPath S&P 500 VIX Short-Term Futures ETN)
EWG (iShares MSCI Germany Index Fund)
CAT (Caterpillar)
Commentary
I estimated last week that T2108 would reach overbought by tomorrow (Thursday). With T2108 at 60.0%, I think it is unlikely. The S&P 500 (SPY) has stalled out a bit right at the all-time intraday high, and it would take a strong rally to push T2108 through the overbought threshold in one more day. It is earnings season so anything can happen of course, but I am adjusting my forecast to Monday or Tuesday of next week.
In the meantime, all the bullish signals remain. T2108, and thus the S&P 500, still has room to run from here.
I will quickly finish this update with six stocks of interest which are providing (or should provide) the excitement that S&P 500 has not in the past four days.
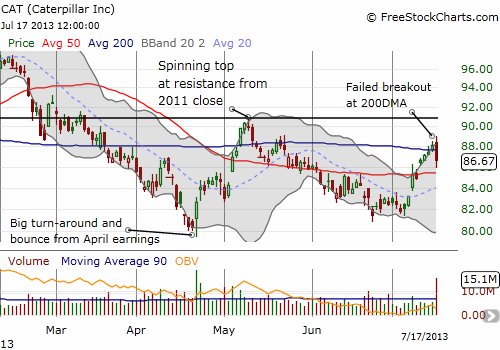
Caterpillar (CAT)
CAT plunged back through its 200DMA in a topping kind of pattern. Volume surged to about twice the daily average. The cuplrit was apparently Dick Chanos. Chanos provided his bearish case on CNBC (video is 2:50 long).
Chanos has long been bearish on China, so I am surprised that his words were able to generate such a sharp and sudden surge in selling on CAT. These fireworks demonstrate the power of Chanos. It will now be incredibly hard for me to remain long the few shares that I have. In the meantime, I will ride the puts I just bought last week anticipating CAT to fail at 200DMA resistance. Going forward, I will likely get even more aggressive on my put buying on CAT.
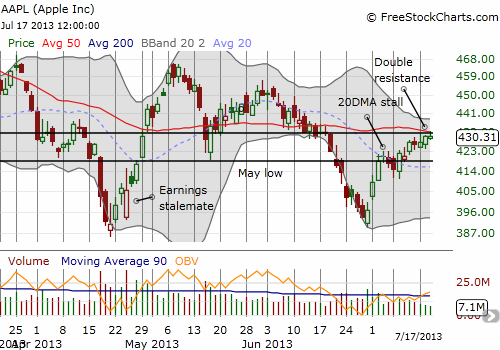
Apple (AAPL)
Yes, my favorite charting (and trading) stock. Hopefully, you are not getting too tired of my constant chatter on it. Anyway, AAPL had another strong start to a week, but it is clearly struggling to break through upper resistance at the convergence of the old $532 pivot and the 50DMA. I took a chance and held onto my calls for the start of the week play; I am looking for the outside shot that AAPL manages to gap higher by Friday. I bought my puts a little early and they are essentially worthless right now.
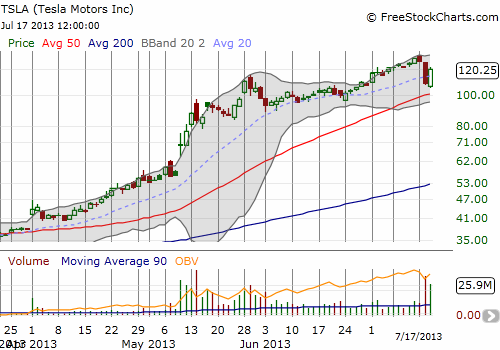
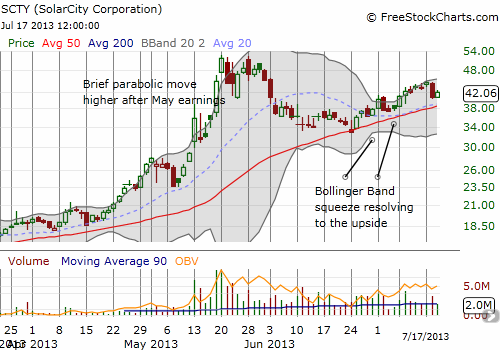
SolarCity (SCTY) (and Tesla (TSLA))
SCTY broke out and started traveling the upper-Bollinger Band almost according to “plan.” Goldman Sachs (GS) ruined things by slapping TSLA with an average target price across three scenarios of $86. In sympathy, fellow Elon Musk stock SCTY came tumbling down. I stretched out this play by holding onto my July $45 calls. Now the race to the buzzer is really hot. I am not likely to win on this one. Note how TSLA came roaring back on extremely high volume. The run on that one is far from over.
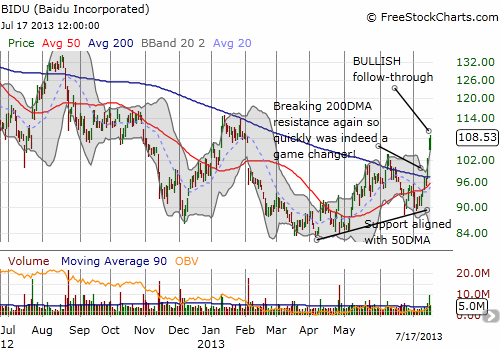
Baidu (BIDU)
This was the HUGE win of the week. The BIDU pop was a great reminder of how it can pay to be patient, stick to the technicals, and execute on the analysis. The moment of truth on BIDU transformed into a major breakout. The very next day, the stock zipped above 200DMA resistance and sliced through $100. On Tuesday, the stock gapped up about 6% on news of an acquisition, and I sold my call options into the open. They expire on Friday, so need to keep pressing my luck on that one.
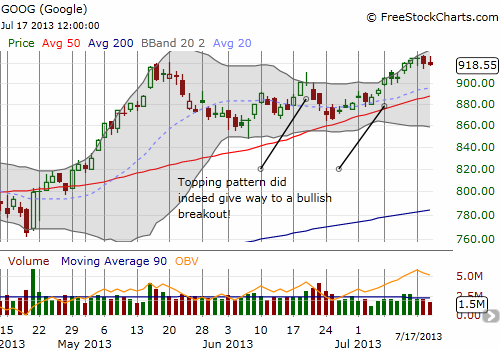
Google (GOOG)
GOOG reports earnings Thursday evening. For some reason, I do not feel particularly compelled to speculate on the earnings. I still believe that GOOG is heading soon to $1000, but I do not expect earnings to propel it there in one day. So, I am thinking I am fine waiting out the post-earnings reaction and making a move from there. Hopefully, I get a trigger-happy sell-off…down to the 20 or 50DMA would be perfect.The stock has conveniently stalled just like the S&P 500 the past three days around the former intraday all-time high.
Daily T2108 vs the S&P 500
")
Black line: T2108 (measured on the right); Green line: S&P 500 (for comparative purposes)
Red line: T2108 Overbought (70%); Blue line: T2108 Oversold (20%)
Weekly T2108

*All charts created using freestockcharts.com unless otherwise stated
Related links:
The T2108 Resource Page
Expanded daily chart of T2108 versus the S&P 500
Expanded weekly chart of T2108
Be careful out there!
Full disclosure: long SCTY calls; long CAT shares and puts; long AAPL shares, calls, and puts