
(T2108 measures the percentage of stocks trading above their respective 40-day moving averages [DMAs]. It helps to identify extremes in market sentiment that are highly likely to reverse. To learn more about it, see my T2108 Resource Page. You can follow real-time T2108 commentary on twitter using the #T2108 hashtag. T2108-related trades and other trades are posted on twitter using the #120trade hashtag)
T2108 Status: 56.0%
VIX Status: 13.8
General (Short-term) Trading Call: Hold – Aggressive traders who got long the breakout should stay long; otherwise, buy dips with tight stops
Active T2108 periods: Day #9 over 20% (overperiod), Day #2 over 50%, Day #32 under 60% (underperiod), Day #36 under 70%
Reference Charts (click for view of last 6 months from Stockcharts.com):
S&P 500 or SPY
SDS (ProShares UltraShort S&P500)
U.S. Dollar Index (volatility index)
VIX (volatility index)
VXX (iPath S&P 500 VIX Short-Term Futures ETN)
EWG (iShares MSCI Germany Index Fund)
CAT (Caterpillar)
Commentary
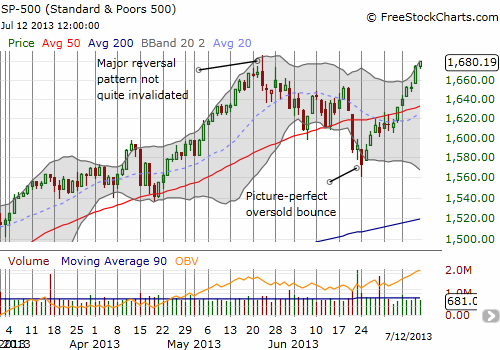
It took a little over six weeks, but the S&P 500 (SPY) finally completed a manic roundtrip that reverses all its losses that essentially began when bond tapering fears gripped the market. While the Federal Reserve, especially Ben Bernanke, said almost nothing new during this time, the market convulsed through a breakdown of the 50DMA to deep oversold conditions to now a strong breakout to fresh, all-time closing highs two days in a row.
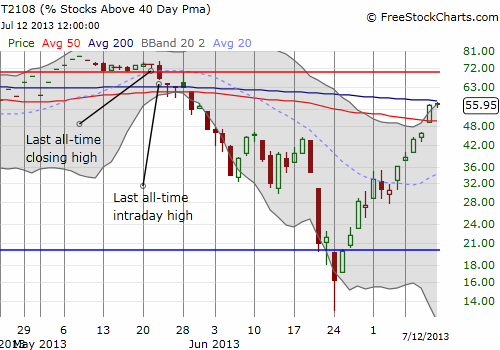
The fascinating part of this run-up is that all-time highs have not yet coincided with a T2108 overbought signal. In fact, at 56.0%, T2108 still has plenty of room to run. I am anticipating an overbought signal by Thursday of next week at the current pace (almost 4 percentage points a day on average). The T2108 chart below compares its level at the last closing and intraday all-time highs in May and the current levels. The chart re-emphasizes how much more room the S&P 500 has before T2108 even gets to overbought, not to mention launch into an overbought rally.
Although there remains rooms to run, T2108, and the S&P 500, have already run at a strong pace. The run from oversold conditions has nearly been straight up for T2108 and for the S&P 500 a brief pause at 50DMA resistance that had an upward bias. A pullback, even if a brief brushback from the bullish plate for a day or two, would not surprise me…but I would not bet on it. Such a dip should be very buyable. The June high at 1652 seems like a natural target.
The S&P 500 has gained a nice 6.8% in the 12 days since the oversold bottom. It reminds me that one of the biggest things missing from my T2108 overhaul is a good way to estimate how long and/or how well/poorly the S&P 500 will do after breaking through a threshold. I tried making 1, 2, 5 and 10-day predictions. (For you machine learning types, I chose Supply Vector Machines with a radial configuration. I figured radial SVM was the best approach given the dispersion of the historical data. The reported error rates are very small but I think that is because the projection is just as likely to be too high as it is too low). The predictions generally only have an upward bias for short oversold durations; one implication is that a trader must be prepared for multiple oversold periods occurring close together. The two graphs below show how historical data drive predictions for S&P 500 performance after 1, 3, 5, and 10 trading days in the 20% overperiod based on the number of days T2108 spent in the 20% underperiod (oversold). In most cases, the longer T2108 spends in oversold territory, the worse the predicted short-term performance for the S&P 500.
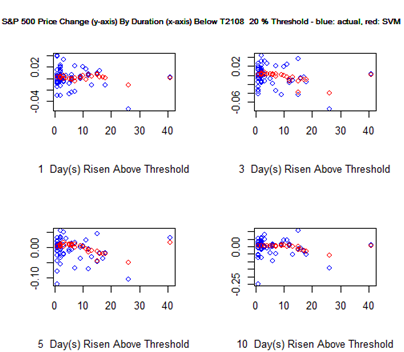
The previous oversold period only lasted 2 days (the typical oversold period lasts 1 or 2 days). However, it is VERY unusual for the S&P 500 to perform THIS well so soon after an oversold period of ANY duration. This is the context by which I chose to release my well-timed SSO calls so quickly. I expected churn and multiple opportunities to get back in at good prices (even a slip back into oversold territory once or twice).
The chart above is also a reminder of why I prefer the aggressive strategy of playing oversold conditions by buying BEFORE oversold conditions end. After they end (and they always do), the margin of performance is much slimmer. As I noted in my comprehensive analysis of oversold trading, the benefit of waiting is a sharp reduction in downside risk (smaller drawdowns). Finally, the chart also shows that even after two weeks, traders may need more patience for the payoff from buying after oversold conditions end: there is the possibility for multiple oversold periods to occur in rapid succession before a lasting bottom finally gets printed (yet one more graphic I need to produce one of these days!).
I needed this patience for two of three of my oversold purchases in individual stocks. F5 Networks (FFIV) went absolutely nowhere after the S&P 500 bounced out of oversold conditions. The stock finally sprang to life in the last three days. I sold my FFIV calls toward the end of the second day with the stock trading against 50DMA resistance and just over a week to go before expiration. The long wait made me very eager to lock in profits, but of course I now wish I had exercised just ONE more day of patience!
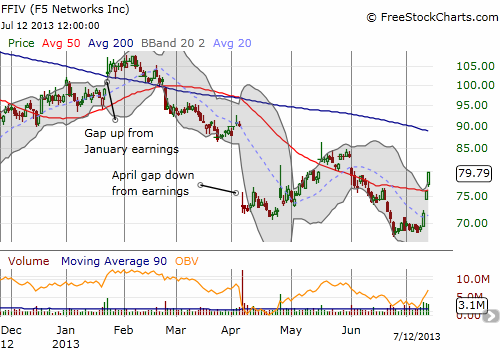
T2108 tells us that there are plenty of stocks left just like FFIV that are late bloomers for the post oversold bounce. As traders and hedge funds scramble to play performance catch-up, beaten up stocks like FFIV look more attractive than ever given the apparent upside potential between here and previous highs or even natural overhead resistance.
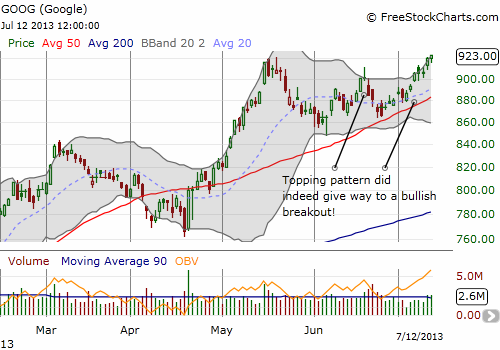
Consol Energy (CNX), a second pick, has only come alive in the past week, and I am now trying to wait out the clock to make a profit. My call options expire this coming Friday. Finally, Google (GOOG) has been a great play, but I have not even come close to maximizing the opportunity. The first set of calls were wasted with poor timing. The second set of calls had perfect timing and generated large profits. I never executed a third round to play what has become a very persistent drive following the upper-Bollinger Band to fresh all-time highs. With buying volume picking up, I think GOOG is a lock for $1000 in the near-term. I plan to get more aggressive, but I still prefer to enter on SOME kind of dip.
Daily T2108 vs the S&P 500
")
Black line: T2108 (measured on the right); Green line: S&P 500 (for comparative purposes)
Red line: T2108 Overbought (70%); Blue line: T2108 Oversold (20%)
Weekly T2108

*All charts created using freestockcharts.com unless otherwise stated
Related links:
The T2108 Resource Page
Expanded daily chart of T2108 versus the S&P 500
Expanded weekly chart of T2108
Be careful out there!
Full disclosure: long GLD