
(T2108 measures the percentage of stocks trading above their respective 40-day moving averages [DMAs]. It helps to identify extremes in market sentiment that are highly likely to reverse. To learn more about it, see my T2108 Resource Page. You can follow real-time T2108 commentary on twitter using the #T2108 hashtag. T2108-related trades and other trades are posted on twitter using the #120trade hashtag)
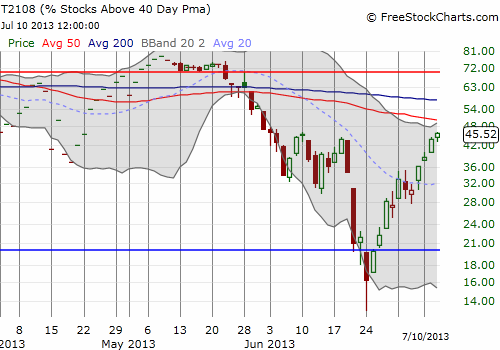
T2108 Status: 45.5%
VIX Status: 14.2
General (Short-term) Trading Call: Hold (Aggressive traders who got long the breakout should stay long)
Active T2108 periods: Day #7 over 20% (overperiod), Day #2 over 40%, Day #28 under 50% (underperiod), Day #34 under 70%
Reference Charts (click for view of last 6 months from Stockcharts.com):
S&P 500 or SPY
SDS (ProShares UltraShort S&P500)
U.S. Dollar Index (volatility index)
VIX (volatility index)
VXX (iPath S&P 500 VIX Short-Term Futures ETN)
EWG (iShares MSCI Germany Index Fund)
CAT (Caterpillar)
Commentary
Ordinarily, I would have called today’s close on the S&P 500 (SPY) a stalemate that potentially signals a reversal in fortunes for the index. The flat close occurred right at resistance from the June highs.
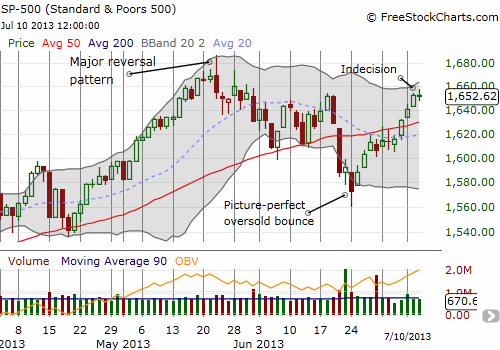
However, the news cycle rules right now. The stalemate during market hours occurred as the market dipped ahead of the release of the minutes of the last Federal Reserve meeting on monetary policy, spiked up in trigger-finger response to the release, and then calmed back down to settle at flatline. However, it is what Fed Chairman Ben Bernanke said during the Q&A of a speech later in the day that may have tipped the balance. As reported in Reuters:
“…the Fed needed to keep a stimulative monetary policy in place given the low level of inflation and a 7.6 percent unemployment rate that ‘…if anything overstates the health of the labor market…The overall message is accommodation…highly accommodative policy is needed for the foreseeable future.'” [Ben Bernanke words in single quotes]
At the timing of writing, S&P futures are soaring higher and some Asian stock markets are quoted at three-month highs…it could be a nice gap up for the S&P 500 come morning.
As a reminder of how well the Japanese stock market (NKY) has recovered, here is the Nikkei:
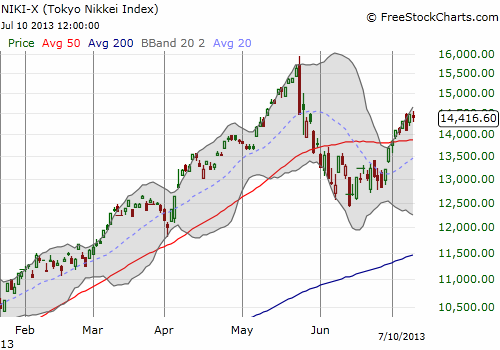
The rapid end of the Nikkei’s bear market, and its ability to recover above the 50DMA, is a bullish “suggestion” for the S&P 500. (See “The Yen, The Nikkei, And The S&P 500: Watch The Trends And Correlations“).
While the S&P 500 ended in a stalemate, the dollar closed the day as a resounding loser. It was an indicator that the foreign exchange traders may have experienced extreme disappointed in the minutes as they did nothing to support the strong surge in the U.S. dollar (UUP) since mid-June. Note how neatly the index bounced off the QE2 reference price level.
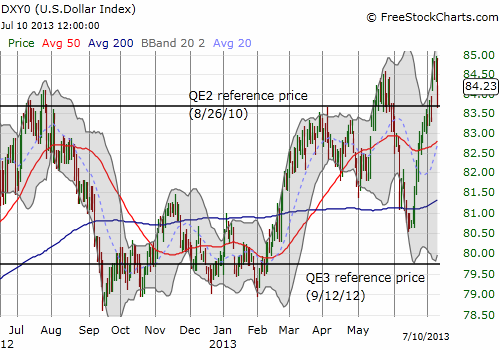
At the time of typing, the U.S. dollar continues to get walloped. The rapid shift in direction for the dollar should cause sharp ripples in bets on a continued rally in the dollar. I am particularly looking forward to a fresh rally in gold (GLD).
Finally, T2108 itself has rallied sharply in the past several weeks. As indicated in a previous post, it is this strength that kept me from attempting a fade of the S&P 500 as it struggled to break 50DMA resistance ahead of the U.S. jobs report. Now I am wondering how much longer this can continue before a reversal. I am guessing that the same churn that hit in June will soon manifest for July, especially as earnings season begins.
Daily T2108 vs the S&P 500
")
Black line: T2108 (measured on the right); Green line: S&P 500 (for comparative purposes)
Red line: T2108 Overbought (70%); Blue line: T2108 Oversold (20%)
Weekly T2108

*All charts created using freestockcharts.com unless otherwise stated
Related links:
The T2108 Resource Page
Expanded daily chart of T2108 versus the S&P 500
Expanded weekly chart of T2108
Be careful out there!
Full disclosure: long GLD