The inverse correlation between the U.S. dollar and the stock market has snapped back into play with a vengeance since the 15-month closing highs for the S&P 500 set on January 19th. On that day, the dollar index rose for a second day, forming what was to become the bottom of a small pullback in the middle of a sharp dollar rally. Since Jan 19th, the dollar index has gained 3.9% while the S&P 500 has dropped 7.6%. By late December, it seemed that the stock market had finally decoupled from the dollar. It looks like that period will remain the exception and not some new rule.
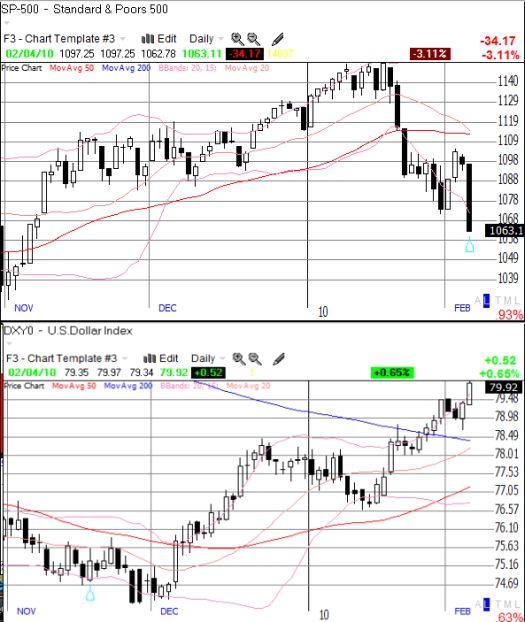
(Click here for my review of currency signals that suggested that trouble was brewing and setting up the market for a sell-off like Thursday’s.)
There are several other interesting features of the current sell-off that may provide hints to what is coming in the near-term future. Overall, I still think that the S&P 500 has finally printed a top that could last for many months to come. However, a powerful short-term buying opportunity could be right around the corner.
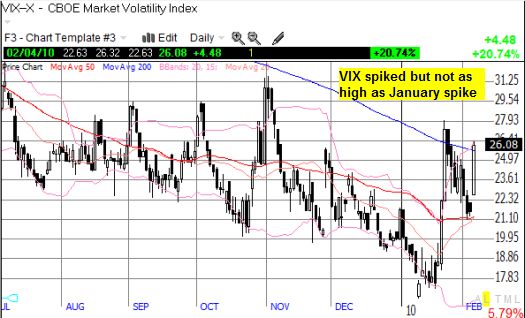
First, the S&P 500 set a fresh low for 2010 on Thursday but the corresponding spike in the VIX was below the spike on January 22. On that day, the S&P 500 fell below the 50-day moving average (DMA) for the first time since October. The VIX also printed a significantly higher high – the only one of this entire rally. I have to assume that the next higher high in the VIX will also signal a buying opportunity.
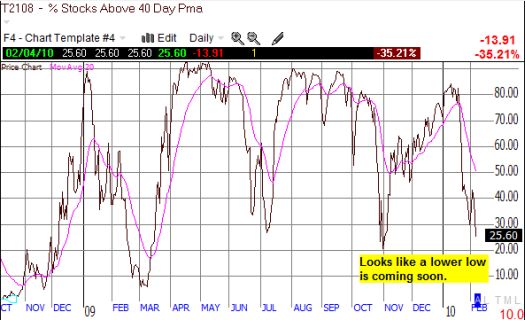
Next, T2108, the percentage of stocks trading above their 40DMA, continues its descent. Last week, I suggested this index would finally crack 20% and reach oversold levels (for the first time since March!). T2108 is now reading 25.6%. A lower low on this indicator seems almost certain given that no amount of jobs reported on Friday morning can erase the debt-driven gloom engulfing the market. The good news is that the historical record on VIX spikes and oversold conditions on T2108 indicates that the next plunge in T2108 could be a strong buying signal.
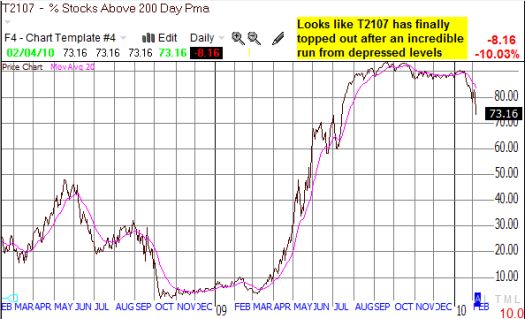
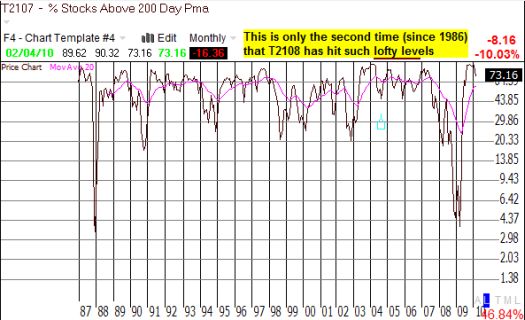
T2107, the percentage of stocks trading above their 200DMAs, has finally fallen from its lofty and comfortable perch. Since 1986, the only other time this indicator remained so high for so long was during the 2003 rally. The first chart below shows a double-top in September and October where an incredible 93% of all stocks traded above their 200DMA. January’s fast start did not return this indicator to its old highs, creating a minor bearish divergence. Add in the series of climactic tops in significant stocks that we observed during early January (for example, Intel, Caterpillar, and healthcare), and it is looking more and more like the S&P 500 has set a top for many months to come.
The second chart shows the long-term historical record.
*All charts created using TeleChart:

So, overall, it seems a top is in, but evidence is accumulating that suggests a major buying opportunity is coming soon (or at least a time to close out shorts). However, until more technical strength appears in the market, the benefit of the doubt goes to selling/shorting rallies from here. Sovereign debt issues will expose, yet again, how little we truly understand or control the dynamics of the globally interconnected economy. This growing realization should keep financial markets more or less on edge until authorities find some kind of resolutions (comforting words will not count). Hopefully, we will not return to anything close to a 2008-like panic, but we will rapidly lose the blissful serenity that was 2009 (post-March).
Be careful out there!
Full disclosure: long VXX

Hello
Interesting case u got here. I noticed that you choosed to use the Arithmetic T2107 & at T2108
Is there any particular reason for that? instead of using the Log?
Regardings Adrian
Good catch. I usually use log scale for charting, and I did not make a conscious decision to use arithmetic for the indicators. However, since the indicators have a locked scale (0-100%), an arithmetic chart is just as good.