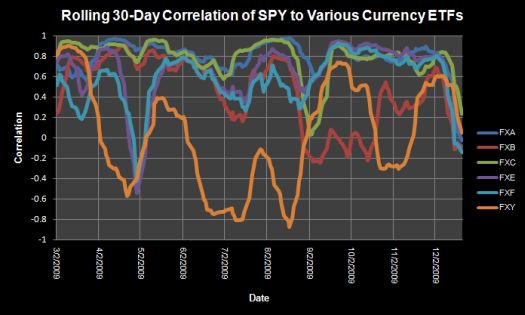
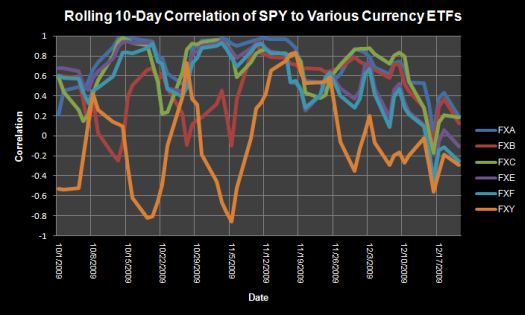
By now, everyone has noticed that the inverse relationship between the stock market and the U.S. dollar has broken. For December, the U.S. dollar index is up a healthy 4.7% while the S&P 500 is up 2.1%. I created two charts to demonstrate the dramatic nature of the change relative to trading before December.
The first chart shows a rolling 10-day correlation between SPY, the S&P 500 ETF, and various currency ETFs (an index is provided below). The second chart shows a 30-day rolling correlation. Data are through Monday’s trading.
Correlation ranges from -1 to 1 and essentially describes the degree of relationship between two (or more) variables: a correlation of 1 means that two variables always move in the same direction by the same factor; a correlation of -1 means that two variables move in opposite directions by the same factor; a correlation of 0 signifies the absence of any relationship. I chose the currency ETFs because the data is readily available, and they show open and close based on U.S. trading hours. All the currency ETFs are measured against the U.S. dollar: the higher the price of the ETF, the stronger the currency versus the U.S. dollar. I broke out the analysis on a currency-by-currency basis to examine whether any currency was exerting particular influence on the currency-stock market correlation. (Note that the euro constitutes the majority of the index at 57.6%, and the Australian dollar is NOT in the index).
The charts below show how the correlation between the currencies and the SPY have converged: the range of correlations this month have contracted. In particular the correlations using the pound (FXB) and the yen (FXY) migrated into the range formed by the other currencies. The rolling 30-day chart shows this convergence most dramatically. December marks the FIRST time during the rally off the March lows that all the major currencies have converged into such a tight range for the 30-day correlation (0.2 to -0.2). Moreover, the currencies as a group have never been so weakly correlated with the stock market. The 10-day rolling correlation just confirms the persistence of the convergence and the decline on a shorter timeframe.


Currency ETF Index:
FXA: Australian Dollar
FXB: British Pound STerling
FXC: Canadian Dollar
FXE: Euro
FXF: Swiss Franc
FXY: Japanese Yen
Just a month ago, like most people, I would have assumed that the current surge in the dollar would accompany downward pressure on the stock market (here is stock market veteran Art Cashin from UBS still insisting “it’s all about the dollar“). While the correlation that has worked for so long appears broken, it is possible the correlation has only changed. For example, stock market participants may be anticipating an imminent resumption of weakness in the dollar (correlation with expectations). It is also possible that carry trades are transferring back to the yen now that the U.S. treasury yield curve has steepened. The 10-day chart above shows that recently the yen has been inversely correlated to the market and the correlation has been a lot more stable (albeit trending downward).
I had claimed earlier that stock market bulls could not be true contrarians because they had to join the consensus of dollar bears to support predictions of ever higher stock prices. If the stock market decouples from the dollar on a sustained basis, these contrarian bulls get a big “2-for-1” boost. This market continues to deliver plenty of surprises…
Be careful out there!
Full disclosure: long TBT, FXA

Exactly! I agree that the dollar-equity correlation has broken with the yen resuming its role.