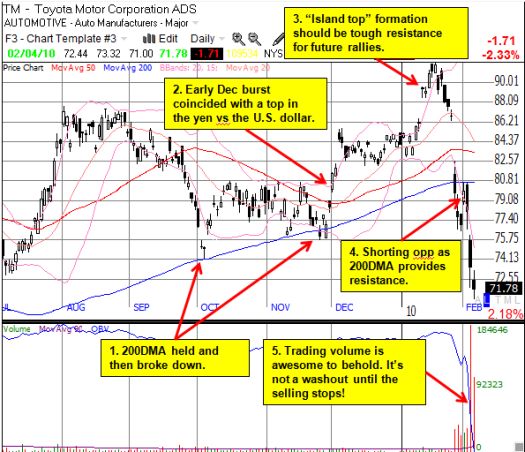
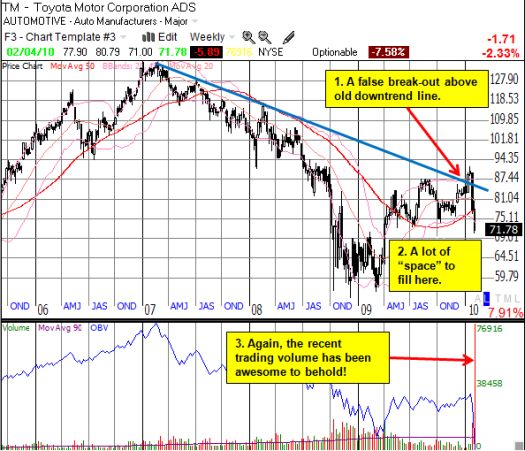
Toyota’s stock first broke down in late November when it plunged below the 200-day moving average (DMA) for the first time since 2007. Unlike 2007, this technical break led to a sharp rally and not a sustained sell-off. (At the time, I suggested a counter-trend rally was likely, especially if the yen weakened; but I never even guessed how strong such a rally could get. I certainly did not expect the summer’s peak to break).
The latest break of the 200DMA could signal the resumption of a downtrend in Toyota (TM) that started in early 2007. As TM struggles to regain control over its quality issues and public reputation, the trading action may be telling us that the damage will be deep and long-lasting.
The charts below review the technical situation with TM from a daily and a weekly perspective.


*All charts created using TeleChart: 
Be careful out there!
Full disclosure: TM calls left over from hedged short positions.

1 thought on “Toyota Breaks Down Again”