

Housing Market Intro and Summary
While Congressional passage of landmark housing legislation positively changed sentiment toward home builders, the underlying housing data continues to point toward stasis. Only existing home sales showed life in May while all the other indicators deteriorated or remained flattish. A decline in builder sentiment for May suggests that housing data will remain tepid for months to come even after earnings from builder KB Home suggested some kind of trough occurred in the first quarter.
Here is a summary for May’s housing market update:
- Home builder stocks rallied on optimism surrounding the 21st Century ROAD to Housing Act, but future gains will likely require new catalysts beyond legislative approval.
- Builder confidence weakened modestly while single-family housing starts, permits, and new home sales continued to reflect a sluggish market constrained by affordability.
- Existing home sales posted an unexpected sequential increase, but a multi-year range remained firmly in place as affordability improvements were small.
- Regional housing performance remained highly uneven, with weakness in the South (with a particular focus on Texas) contrasting with relative resilience in parts of the Northeast and Midwest.
- Elevated inventory, persistent affordability challenges, and stubbornly high mortgage rates continued to reinforce a broader theme of stasis across the housing market.
- Bed Bath & Beyond announced a strategic plan to leverage Federal legislation. The extensive analysis and ambitious objectives look heavily assisted by brainstorming and writing from ChatGPT.
- Google disrupted the housing listings business even as Zillow and Redfin fight charges of anti-competitive behavior in the rental market.
Housing Stocks
The iShares US Home Construction ETF (ITB) managed to break out above its bear market line (marking a 20% loss from the all-time high set in 2024) thanks to Congressional passage of The 21st Century ROAD to Housing Act. I was quite surprised by the strong sector-wide reaction, including a 6.1% gain for ITB, given House passage in May put the bill on track for eventual passage. I covered the positive reactions and commentary in my last Housing Market Review, and I assumed at the time that Congress would pass the bill. It has strong bipartisan support. Even with the President stalling final approval in order to get concessions on another bill, Congress’s apparent eagerness to get this win going into the midterm elections means that the bill should survive…and I will be even more surprised if final approval generates a fresh rally (and accordingly I sold a call option against my long-standing position in ITB). In the meantime, ITB is holding the line at support from the bear market line (see the purple line below).
I believe this housing legislation and the unfolding responses to it will dampen the seasonal behavior in home builder stocks. The ongoing industry consolidation, with Taylor Morris Home Corporation (TMHC) being the latest target, provides both a presumed floor to the value of home builders and the potential for any builder at any time to attract acquisition interest. I do not expect any of these dynamics to exhibit seasonal patterns.
")
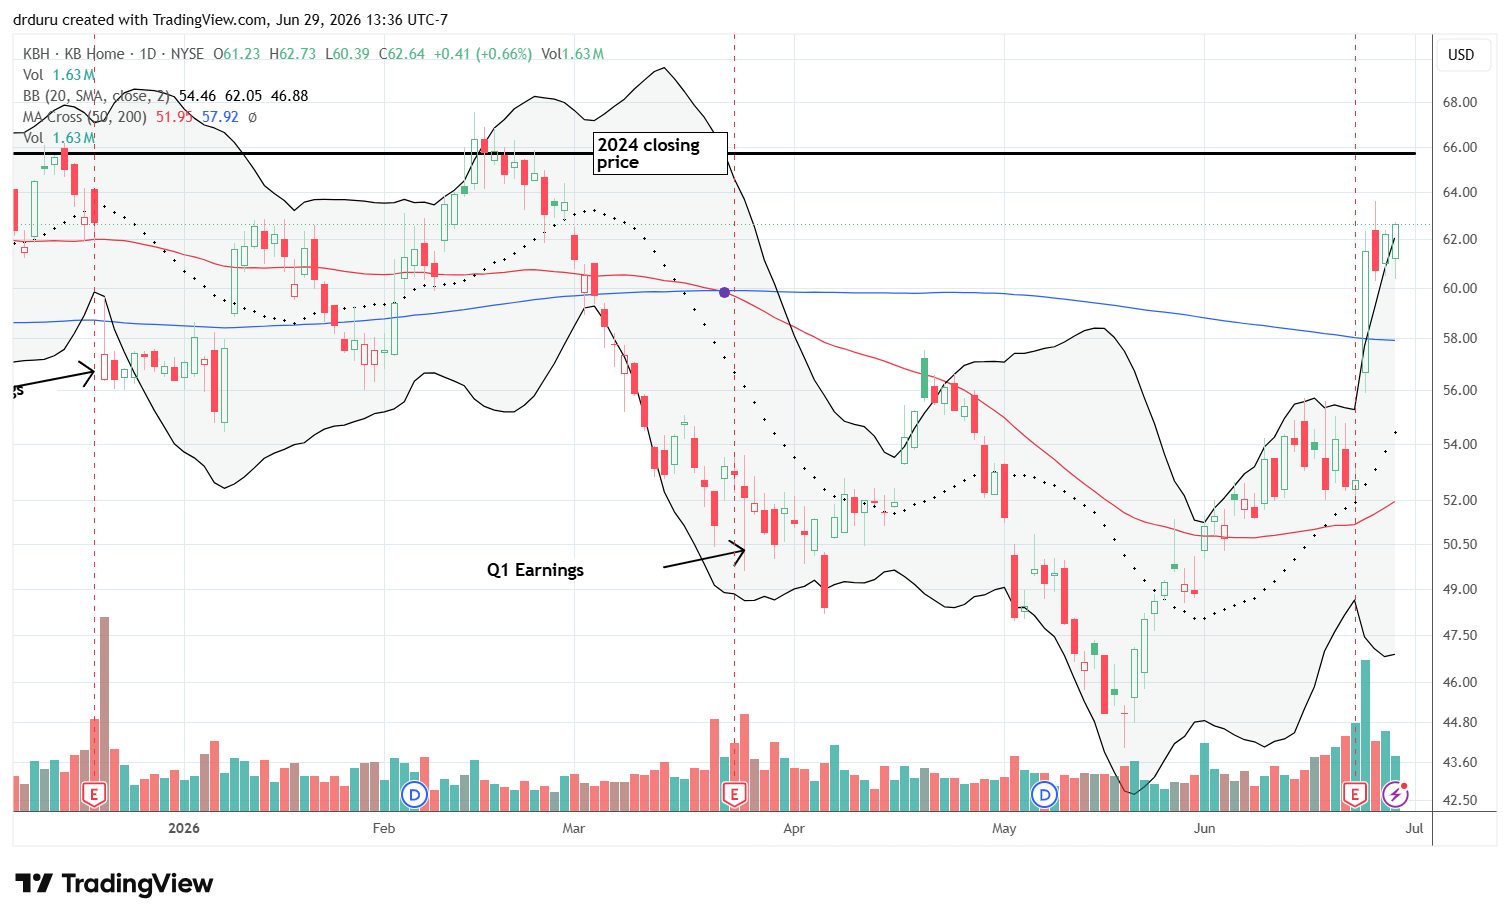
KB Home (KBH) surprised me with a 16.7% post-earnings surge. Earnings for Q1 were disappointing enough for me to bring an official end to the seasonal trade on home builders. The builder was fortunate enough to report earnings the evening before Congressional passage of The 21st Century ROAD to Housing Act. So far, buyers are keeping the stock elevated despite what reads as another tepid report from KBH. The market’s positive reaction to Q2 earnings likely reflects a reduction in uncertainty from more detailed guidance and the company’s claim that the business hit a trough in Q1.
Housing Data
Home Builder Confidence: The Housing Market Index – June, 2026
The National Association of Home Builders (NAHB)/Wells Fargo Housing Market Index (HMI) dropped 2 points from 37 in May to 35 in June. The NAHB lamented that “this is the 14th straight month that sentiment has remained below 40, a streak not seen since 2011-2012 during the foreclosure crisis.” No wonder the organization called May’s jump “modest.” The NAHB also took this opportunity to once again call for reducing regulations that are driving up the cost of building new homes citing its own study showing 26% of the cost of a new home comes from “government regulation, taxes, fees and other costs.”
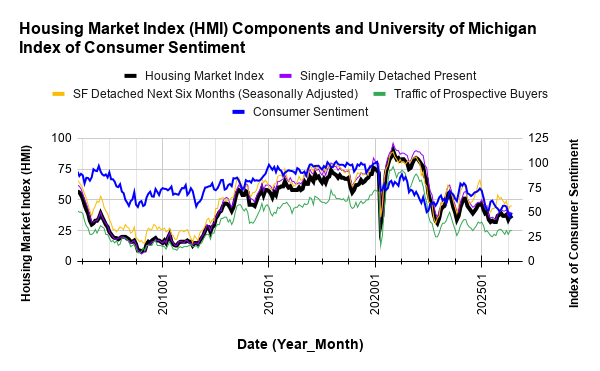
The components of the HMI present a bit of good news. The entire drop in the HMI was driven by a two point pullback in the “Single-Family: Present” component. The other two forward-facing components remained flat. Thus, on a relative basis, home builders did not retreat from their outlooks even as present conditions deteriorated a bit.
/Wells Fargo Housing Market Index (HMI) and the University of Michigan Index of Consumer Sentiment")
Source for data: NAHB and the University of Michigan
Consumer sentiment is downtrending while builder sentiment has stabilized. How much lower can consumer sentiment drop (to new record lows) before builder sentiment breaks to new lows?
The dynamics of price incentives were decidedly negative for builders in June, reflecting the drop in sentiment. The share of builders cutting prices increased from 32% in May to 35% in June (the percentage was 36% in April). The average price reduction remained at 6%. The use of sales incentives was 62% in June, up from 61% in May, and extending the streak at or above 60% to 15 straight months.
While the component breakdown for sentiment contains a bit of good news, the regional breakdown is quite negative. The HMI in the South plunged to a level last seen in September. The Northeast region jumped for the second month in a row. At 50 the Northeast is at its highest point for the year and a level last seen in October. The Midwest stayed flat at its high for the year at 45. After remaining stable nearly all year, the South abruptly dropped from its high of the year to a 9-month low at 29. This level was also the low for 2025. As the largest region in the country, sentiment problems in the South could portend bigger issues for the market. The West remained flat at 27 which is just one point above the low for the year.
New Residential Construction (Single-Family Housing Starts) – May, 2026
Single-family housing starts declined despite the jump in builder sentiment last month. May’s 882K in single-family starts represents a 1.9% month-over-month decrease and a 6.7% year-over-year decrease.
The NAHB blamed the declines on a familiar litany of issues: “high interest rates, rising construction costs and ongoing labor shortages.”
![US. Bureau of the Census, Privately Owned Housing Starts: 1-Unit Structures [HOUST1F], first retrieved from FRED, Federal Reserve Bank of St. Louis, June 16, 2026](https://drduru.com/onetwentytwo/wp-content/uploads/2026/06/20260616_Housing-Starts-May-2026.png "Housing starts")
While builders further decreased the pace of starts, permits remain around 3-year lows. Building permits (new privately-owned housing units authorized in permit-issuing places) have stalled out since June, 2025. Permits were 886K, a 0.6% month-over-month increase from April and a 1.8% year-over-year decline. The sluggish activity in permits suggests starts will remain rangebound for quite some time to come.
Starts were mixed across regions. Month-over-month the changes were +18.5%, +3.7%, -5.2%, and -2.3% for the Northeast, Midwest, South, and West respectively. Year-over-year the changes were -3.0%, +5.9%, -3.8%, and -18.0% for the Northeast, Midwest, South, and West respectively.
New Residential Sales (Single-Family) – May, 2026
New home sales declined in May. Sales fell 7.3% from April’s sales of 626K to 580K in May. Year-over-year sales declined 6.8%. The resumption in weakness in the market for new homes takes sales back to the pandemic low and precariously close to the lows from the 2022 trough. This weakness was buried in the news headlines thanks to the bigger news about Congress’s passage of the Federal housing legislation.
While the NAHB attributed March’s increase in sales to greater inventory availability at the lower end of the market. The organization blamed April’s decline on “elevated mortgage rates, higher inflation and economic uncertainty kept more buyers on the sidelines in April as ongoing affordability challenges continue.” The NAHB blamed May’s continued decline on affordability concerns and characterized a market with “cautious buyers and persistent financing constraints.”
Unless new home sales sink further, they look stuck in an extended multiyear range just like existing home sales.
![US. Bureau of the Census, New One Family Houses Sold: United States [HSN1F], first retrieved from FRED, Federal Reserve Bank of St. Louis, June 29, 2026](https://drduru.com/onetwentytwo/wp-content/uploads/2026/06/20260629_New-home-sales-May-2026.png "new home sales")
For May, the median price for new homes increased 2.0% sequentially and was essentially unchanged year-over-year at $424,900. As is often the case, the increase in prices coincided with a shift in the sales mix.
Sales of homes priced over $1M increased from 6% to 7% of sales. The two lowest tiers remained at 45% of sales. The $400,000 to $499,999 tier dropped from 21% to 20% of sales. Still, on a year-over-year basis, the $300,000 to $599,999 range in aggregate is up substantially from a 56% share to a 64% share.
April’s inventory was 9.3 months of sales. May’s inventory increased to 10.3 months of sales compared to 9.7 months a year ago. Absolute inventory increased from 485K to 496K. Note well that once again “greater inventory availability” did not help sales and instead reflected market weakness.
The Northeast, Midwest, South, and the West changed +17.2%, -3.7%, -5.4%, -17.0% respectively year-over-year. Sequentially, the Northeast, Midwest, South, and the West changed +3.0%, +16.2%, -4.1%, -26.9% respectively. The wide swings and variety in regional changes continue to align with the high degree of uncertainty in the aggregate estimate.
Existing Home Sales – May, 2026
Existing home sales surprisingly jumped in May. The National Association of Realtors (NAR) reported a 3.2% month-over-month increase to 4.17M sales and a 3.2% increase year-over-year.

(For historical data from 1999 to 2014, click here. For historical data from 2014 to 2018, click here) Source for chart: National Association of Realtors, Existing Home Sales© [EXHOSLUSM495S], retrieved from FRED, Federal Reserve Bank of St. Louis, June 9, 2026

The organization credited improved affordability for the gain. At an aggregate level, the NAR’s Housing Affordability Index improved from 97.5 to 105.6. Each region also experienced healthy gains in year-over-year affordability: Northeast +5.1%, Midwest +6.6%, South +8.4%, West +11.0%. These affordability gains seem mostly driven by a year-over-year drop in mortgage rates. In recent months, mortgage rates have crept higher, home prices hit a new record, and inventory has barely budged on month of sales basis. Thus, the sequential surge in sales for May looks unsustainable. Healthy year-over-year affordability improvements did not boost April sales.
Total housing inventory in May was 1.55M units, up 3.3% from April and up 0.6% from May 2025. The NAR reported a 4.5-month supply of unsold inventory, unchanged from last month and down from 4.6 months one year ago. As usual, inventory gains did not prevent price appreciation.
The median sales price of an existing home was $429,300 in May, up 2.8% from April and up 1.3% from one year ago ($423,700). May marked the 35th consecutive month of year-over-year price increases.
The REALTORS® Confidence Index showed a median time on market of 29 days in May, down from 32 days in April and up from 27 days in May 2025.
The NAR also reported that first-time homebuyers represented 35% of sales (up from 33% in April and up from 30% one year ago).
Regional sales changes were mixed. Month-over-month sales increased 2.2% in the Northeast, increased 6.4% in the Midwest, increased 3.2% in the South, and were unchanged in the West. The regional year-over-year changes were: Northeast -8.0%, Midwest +2.0%, South +5.9%, West +5.6%.
Single-family existing home sales increased 3.5% month-over-month in May to a seasonally adjusted annual rate of 3.8M and increased 3.3% year-over-year. The median price of a single-family home was $434,300, an increase of 1.3% from a year ago
California Existing Single-Family Home Sales – May, 2026
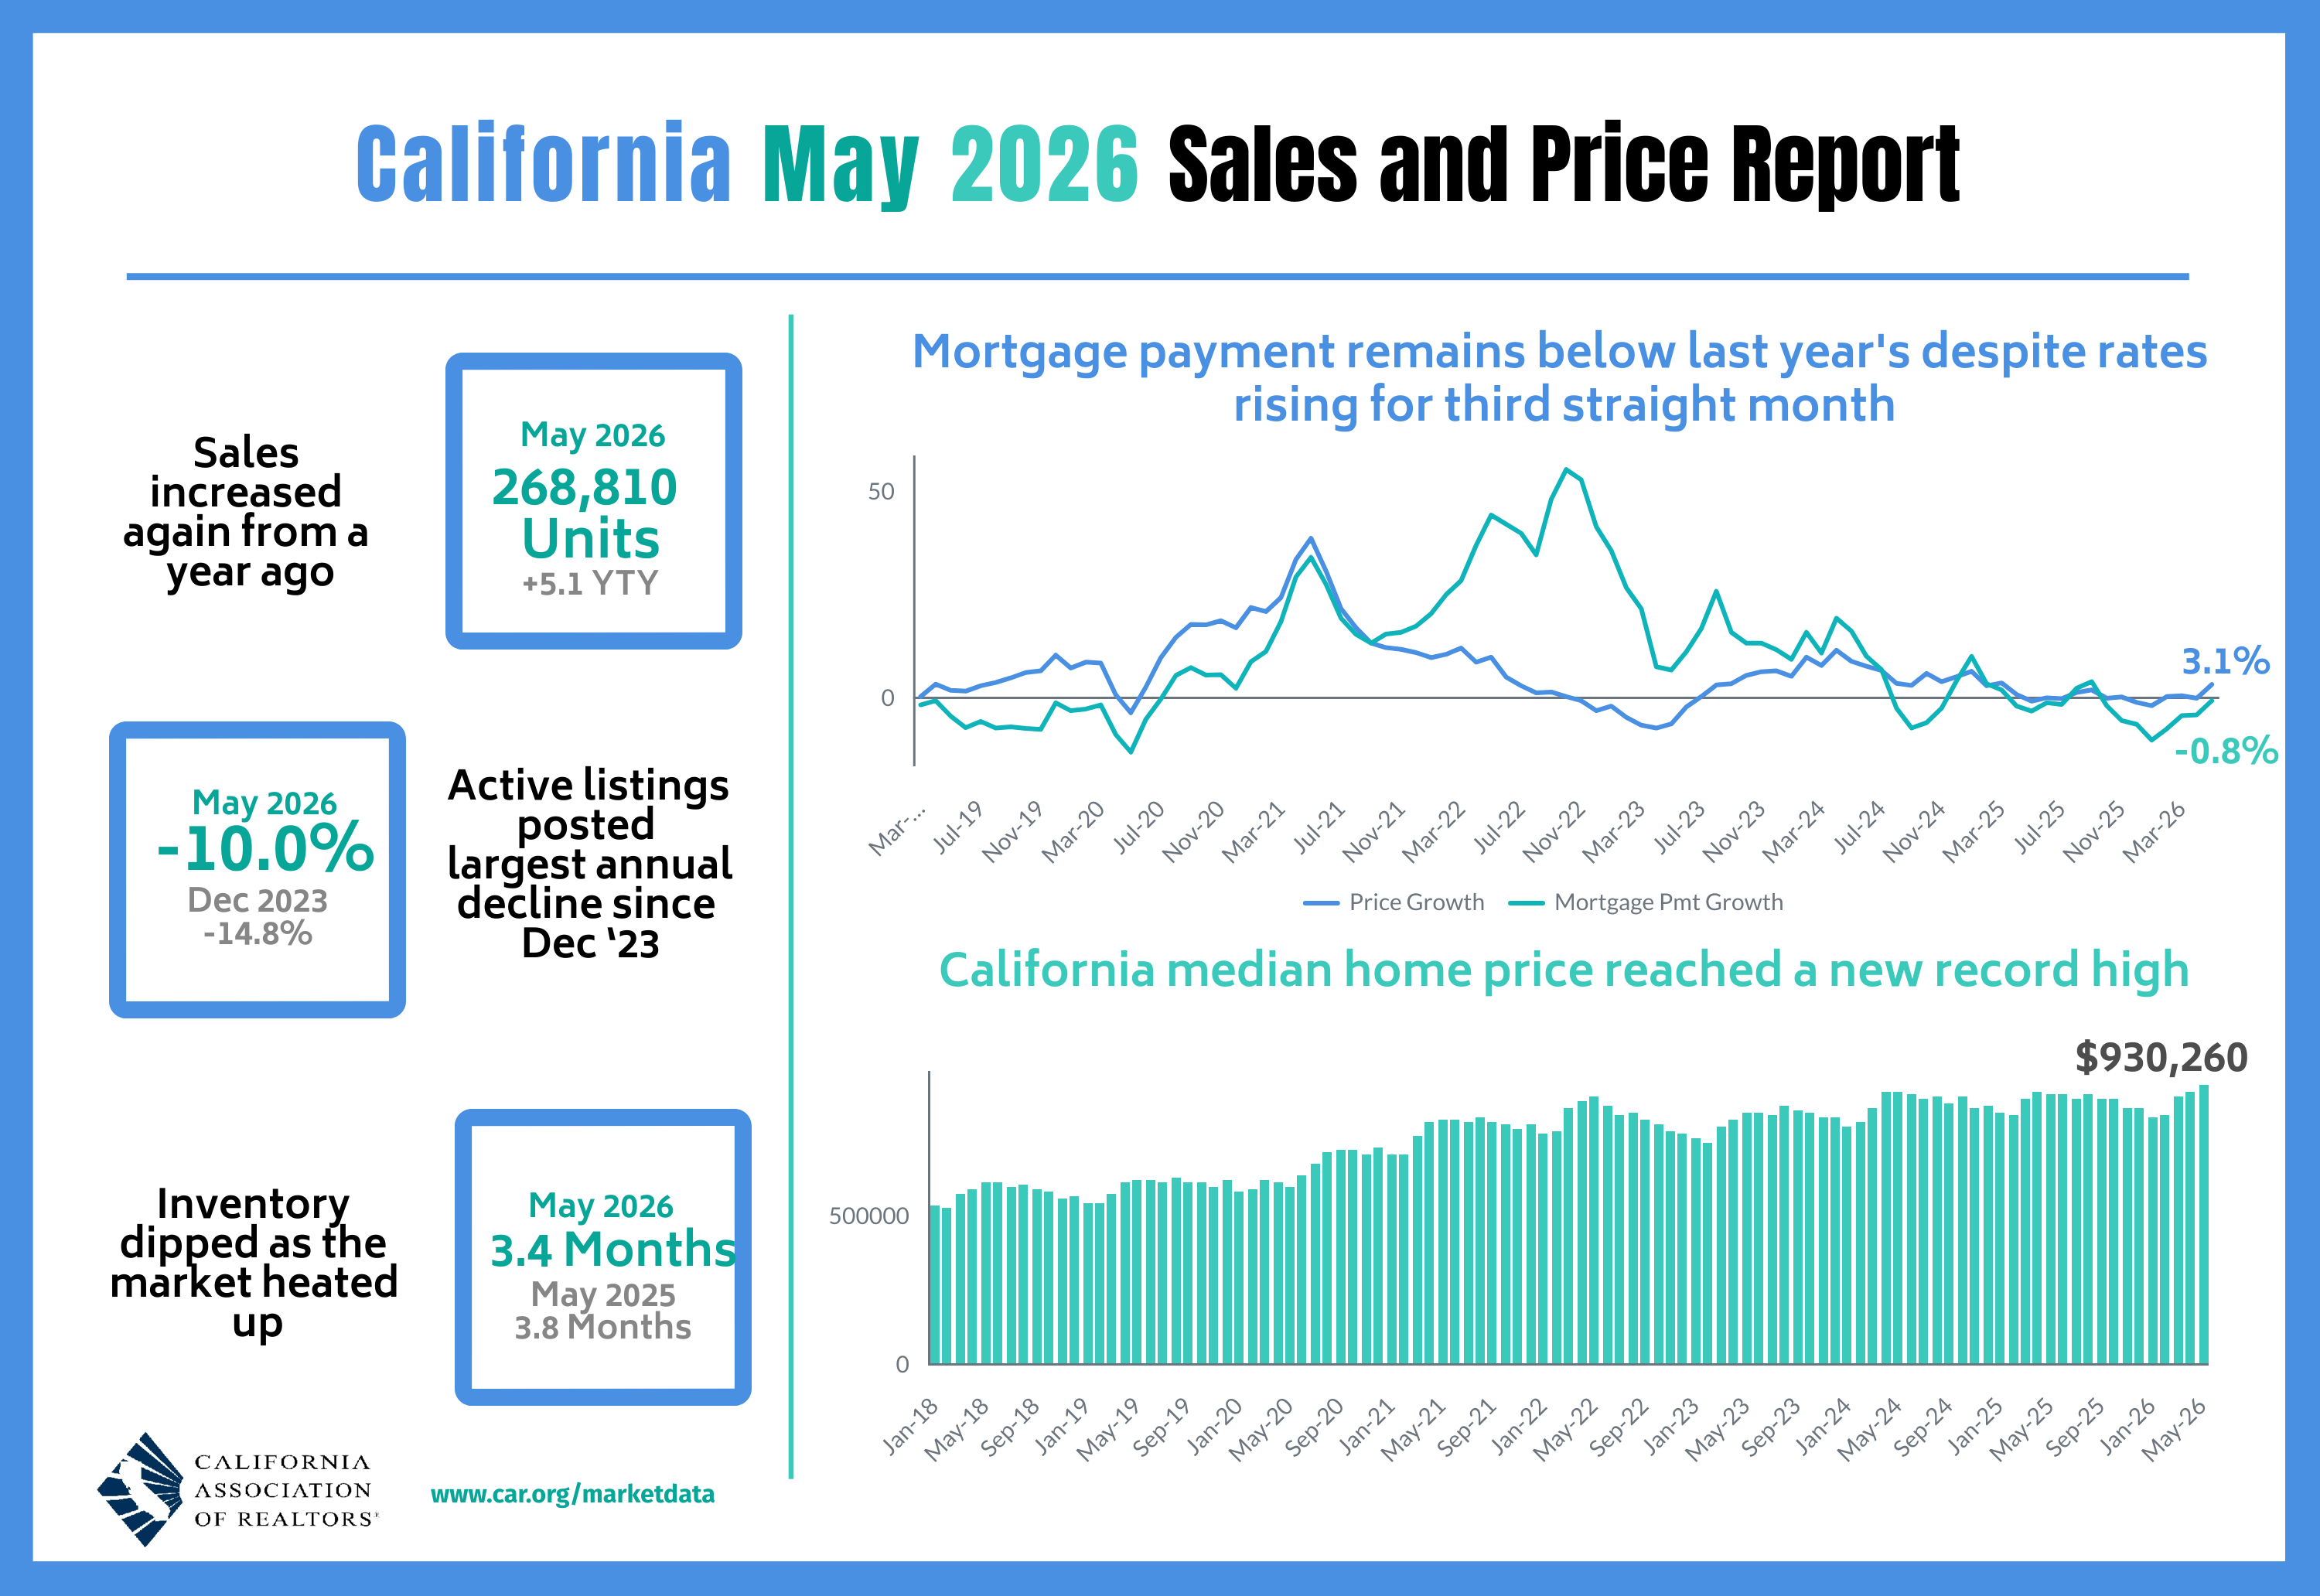
California existing home sales declined in May. The California Association of Realtors (C.A.R.) reported that existing single-family home sales decreased sequentially 3.1% in May to 268,810, up 5.1% year-over-year. The C.A.R. noted that the largest sales increase happened for homes priced above $2M with an 8.5% year-over-year surge. Sales of homes valued above $1M jumped to a record high with an 8.2% year-over-year gain. The organization attributed support for higher-end housing demand to strong equity market performance over the past two months.
The median price increased 2.3% month-over-month and 3.1% year-over-year to $930,260. This price increase set a new all-time high for a second straight month driven by the sales momentum at the high end of the market. The median price per square foot was $447, up from $439 a year ago. Moreover, the sales-price-to-list-price ratio was 100.0% in May, unchanged from April and a year ago.
May’s unsold inventory index (UII), which measures the number of months needed to sell the supply of homes on the market at the current sales rate, increased 3.0% from April and was down 10.5% from May 2025. Total active listings rose from April 2026 but fell year-over-year for a fourth straight month. In the May report, the C.A.R. linked constrained inventory to the “lock-in effect”, where existing homeowners with low mortgage rates are reluctant to move and incur higher mortgage rates for a replacement residence. However, this lock-in has been a salient feature of the housing market for around four years, and May’s mix of inventory effects shows that lock-in is not a consistent driver of inventory dynamics. The C.A.R. expects reduced conflict in Iran to increase buying interest.
The median time on market remained unchanged from 22 days a year ago to 22 days.
Georgia’s Housing Market – May, 2026
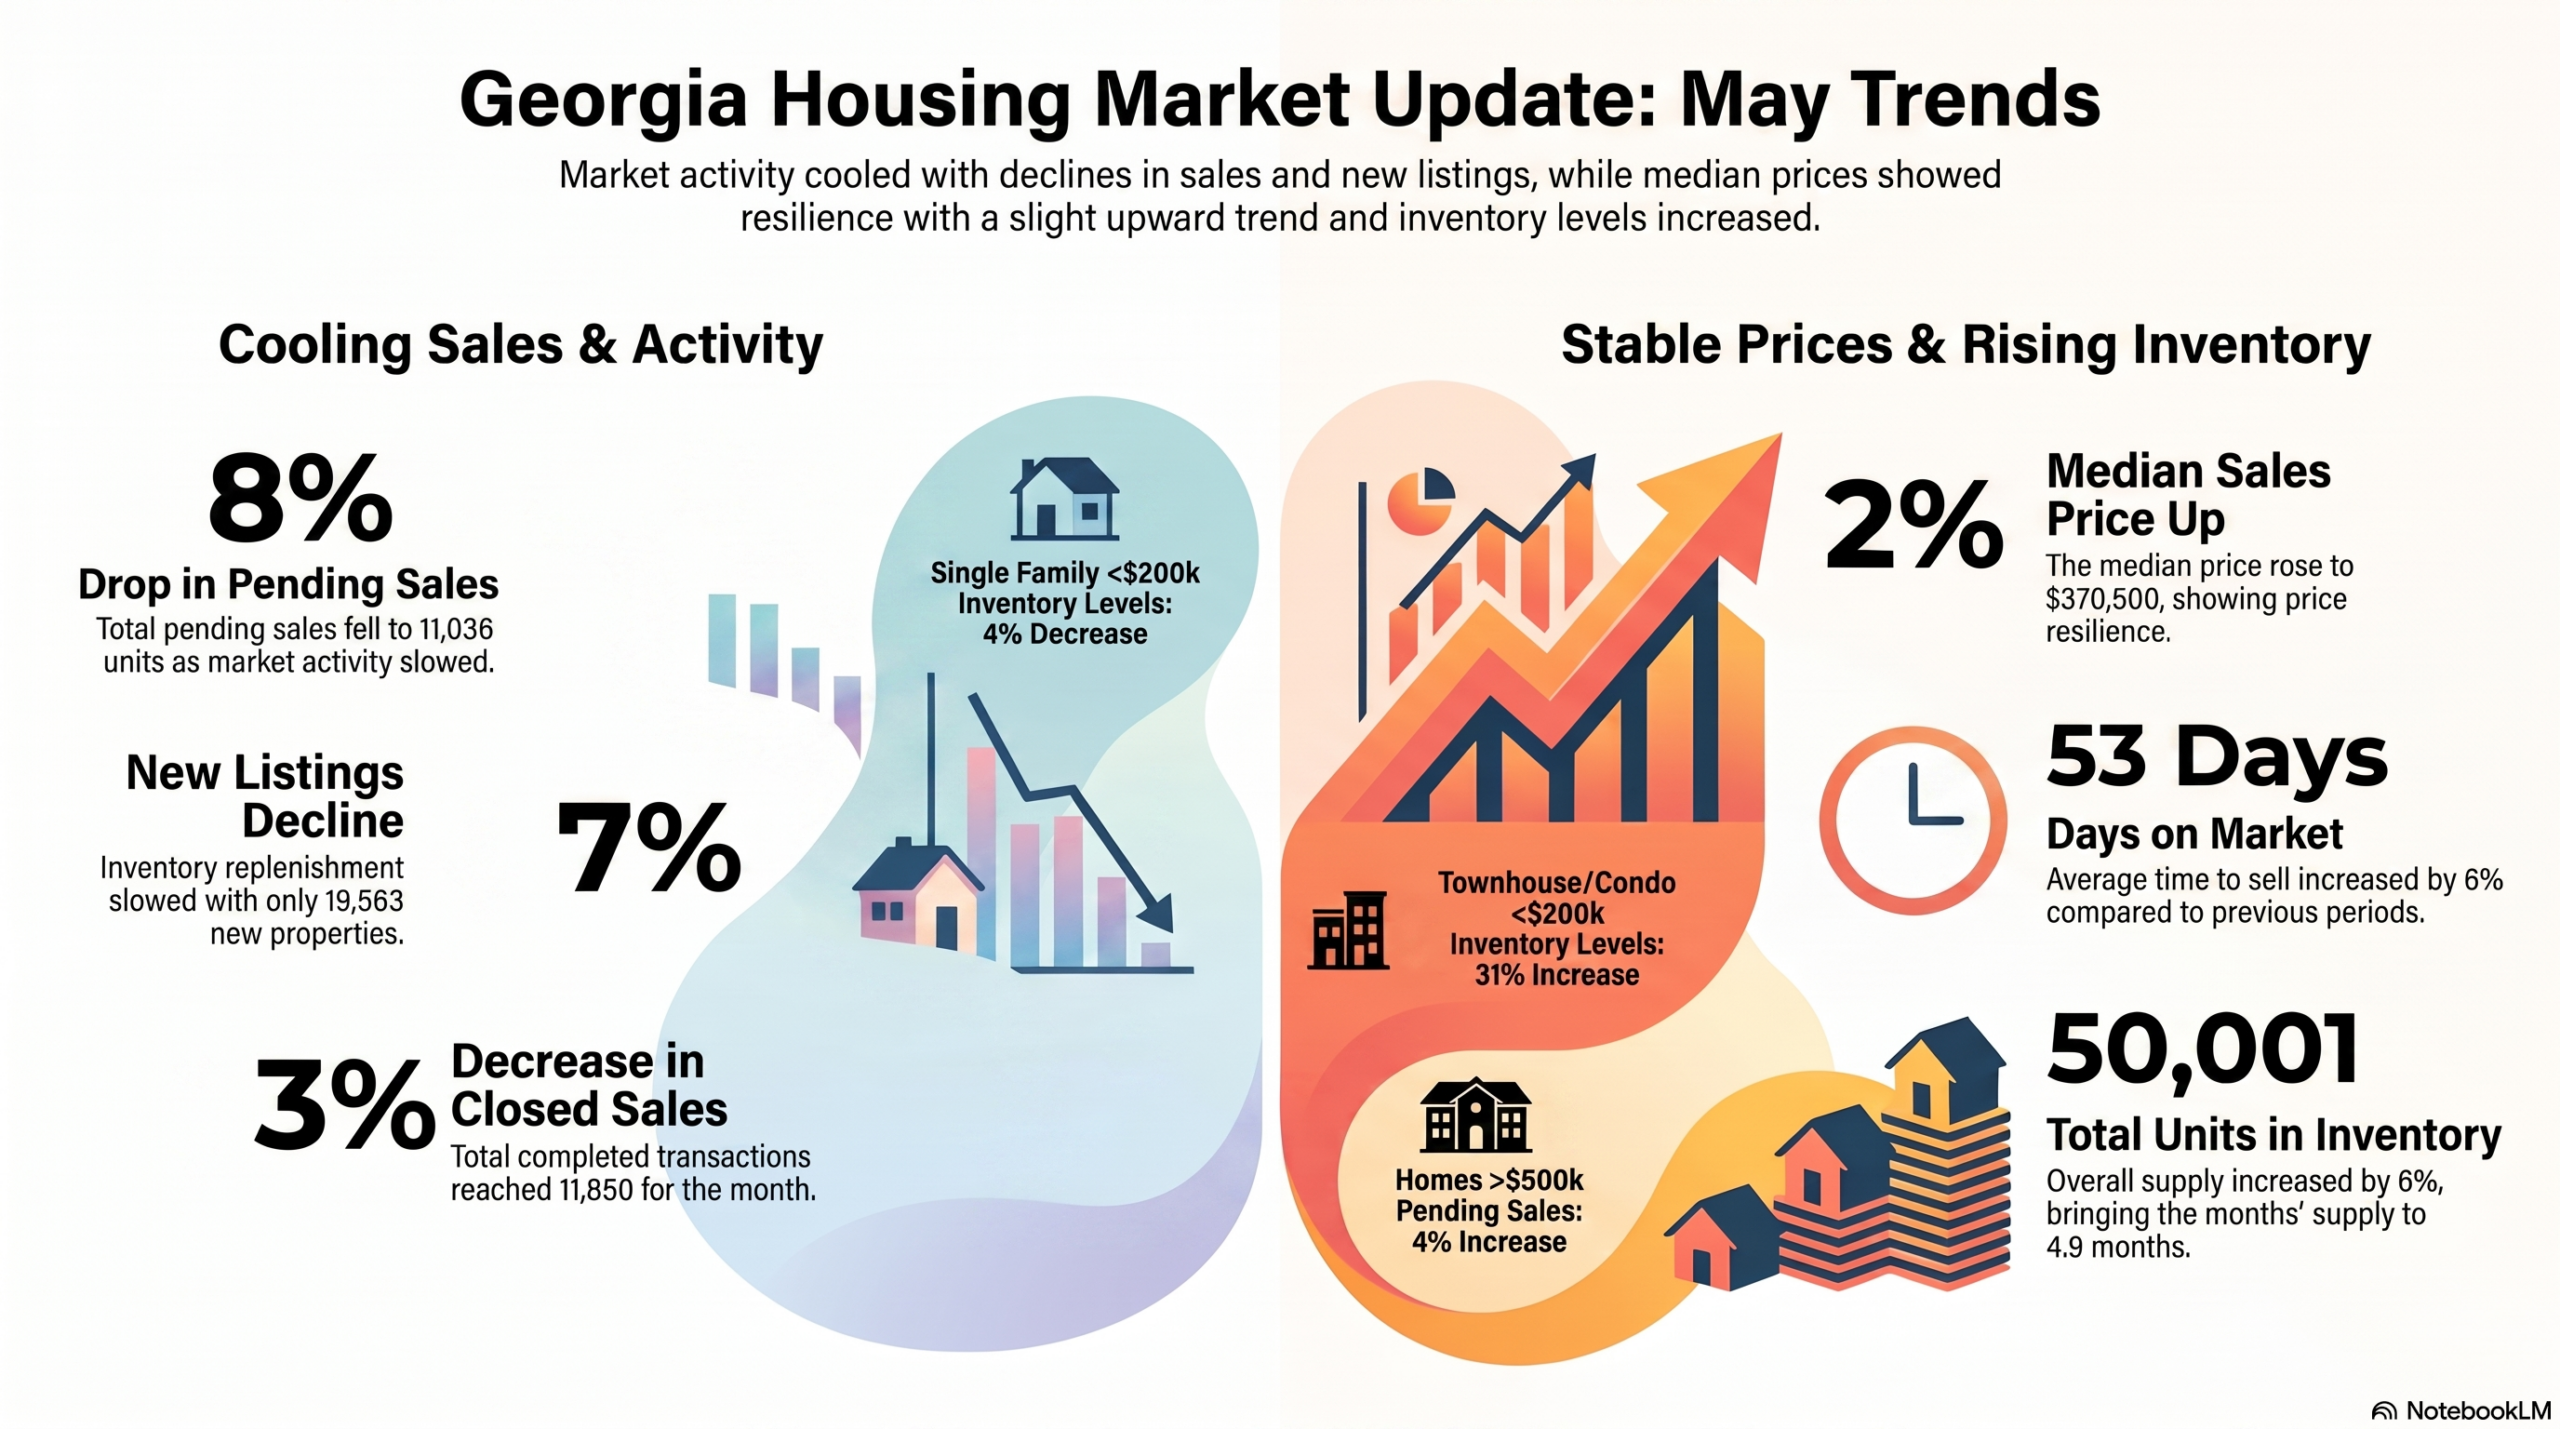
The Georgia Association of Realtors noted that despite the rise in housing inventories, overall inventory remains tight. That tightness likely helps explain the on-going upward pressure in prices even with slowing sales. Georgia’s market, like so many others in the U.S., has very different performance profiles in particular segments.
Home closing thoughts
Beyond the monthly data, several housing-related developments continue to shape affordability, supply, and market structure. Below are some of the more notable stories that caught my interest over the last month or so.
The State of U.S. Housing in 2026
Harvard University’s Joint Center for Housing Studies (JCHS) released its annual report for 2026 on the state of housing in America. Once again, the overtones are dire. From the executive summary:
“Across the US, persistent affordability challenges and rising economic uncertainty are hurting housing markets. Weakening labor markets and plummeting immigration have dampened household growth and mobility. Sales of existing homes sit at three-decade lows and inventories are rising in the face of high homebuying costs. In the multifamily segment, rents fell, demand slipped, and vacancies rose. Although markets are struggling to absorb a wave of new deliveries, cost burdens have hit another record high for renters and worsened for homeowners, and assistance remains profoundly underfunded. In response to federal retrenchment on numerous housing policies, states and localities are seeking new tools to bring down costs and protect their most vulnerable residents.”
The JCHS also produced a summary explaining the reports top ten points:
- Housing activity remains subdued.
- Weak demand joins supply shortages as a top housing headline.
- Housing demand strained by economic uncertainty.
- High housing costs are also depressing demand.
- Housing shortfalls continue, but supply is growing.
- Supply growth varies by location.
- Severe shortages of lower-cost housing remain.
- Cost burdens remain at crisis level for lowest income households.
- High housing costs leave millions with little to spend on other necessities.
- Growing momentum for government policies to boost supply and affordability.
The last bullet covers initiatives in 10 different states to remove regulatory barriers that are slowing housing development. The report was finalized well before the passage of The 21st Century ROAD to Housing Act, but it did include a positive reference to the bill. The other parts of the report are familiar themes that I have covered to varying degrees over the past year.
Inventory Back to Cycle Highs
The NAHB reported total housing inventory, new plus existing homes, at 5.2 months of supply, a 12-year high tying last year’s peak. The group claimed that “moderating prices across both markets have helped support buyer demand amid ongoing affordability concerns” which seems to contradict both the rising median price in May and the lamentation that affordability concerns are hurting sales. I think of the rebound in inventory as further confirmation of growing market weakness, especially given the upward trend looks set to continue.

Texas Housing Bust
I took particular interest in Bloomberg Television’s description of a housing bust in Texas. Texas is one of the country’s largest housing markets in the largest housing region of the South. So what happens economically in Texas could have a ripple effect across a large number of home builders. Bloomberg focused on the north Dallas suburban cities of Frisco, Celina, and Prosper. Thus, the story did not provide statewide evidence of a bust. Instead, there’s an extrapolation of the backlash against Indian H1B Visa holders into the poor housing data in local areas:
- Declining Home Prices: As of February 2026, home prices in the primary growth corridor north of Dallas dropped 9% year-over-year, compared to a 4% decline for the broader metro area.
- Reduced Buyer Demand: The market is at a “standstill” because potential South Asian buyers, who were crucial to the area’s rapid expansion, are stopping their home search due to uncertainty regarding their H-1B or L-1 visa status.
- Over-supply and Competition: Homeowners are facing difficulty selling because they must compete with a “flood of listings,” cheaper new construction, and builder incentives .
- Increased Time on Market: Home sellers are struggling to secure offers, with some individuals reporting zero offers after months of trying to sell their properties.
I will be watching Texas closely for any ripple effects from these challenges.
San Francisco’s Mansion Shortage
While Texas suburbs go “bust”, San Francisco’s real estate market is back to boom times with a swell of “new money” from AI-related businesses. Marketplace reported that “Cerebral Valley”, an area of SF with a high concentration of AI workers, are already able to use their stock to purchase homes. The rush is creating a “mansion shortage” according to one realtor.
Google Busts In
The fortunes for Zillow Group (ZG) took a fresh downward turn after the state attorneys General and the FTC sued the house listing company along with Redfin in September, 2025 for anti-competitive behavior. A 17% post-earnings drop last February motivated the company to authorize a massive $1.25B stock repurchase program. Whatever money they spent has likely gone for naught after Alphabet (GOOG) busted into the listings business with “Enhanced Local Services Ads for Home Listings” moving from a pilot to launch phase. ZG, already trading at multiyear lows, fell 3.1% on the news and resumed its downtrend from there. As long as the housing sales remain stuck in the current ranges, Zillow will suffer from little to no growth in the listings business. A new listings competitor will create an extra drag.
Americans More Open to Buying Instead of Renting
The first paragraph of Bank of America’s latest survey on homebuyers says it all: “For the first time since 2023, a majority of consumers say it’s better to buy a home in the current market…53% of respondents now favor buying over renting or moving in with family (47%).” The survey reports a surprisingly dramatic change in attitudes about housing that I suspect could be driven by persistent and stubborn inflation making the relative stability of a mortgage payment look more attractive. According to Bank of America, renters are downsizing and downgrading in order to save money. Still, more people than last year cite affordability as a top barrier to homeownership, 58% versus 46% last year. Thus, a kind of pent-up demand is apparently gaining steam in the housing market. This development is a positive sign for a potential boom whenever affordability conditions substantially improve. Unfortunately, a catalyst is nowhere on the horizon.
Did Bed Bath & Beyond Post ChatGPT’s Strategic Recommendations to its Management?
Bed Bath & Beyond (BBBY) has fallen on tough times ever since the pandemic brought the company a celebrated, albeit brief, return to the spotlight. With the stock trading close to all-time lows, the company needs new growth initiatives. The company seems to have latched onto The 21st Century ROAD to Housing Act as path to fresh excitement in the company’s prospects.
The company posted a strategic document in the form of a white paper, authored by Marcus Lemonis, Executive Chairman/CEO, that positions Bed Bath & Beyond as the company that “turns policy direction into a consumer, homeowner, community, and market platform.” Lemonis describes the housing economy as “a series of disconnected events” and believes his company can weave these pieces together into one platform for the home buyer and home owner. The white paper is surprisingly detailed, showing a high level of confidence that no other company can execute on this blueprint.
However, the openness could come from the use of publicly available data and information to synthesize the white paper through a large language model (LLM) like ChatGPT. The structure, language, and grammar have the appearance of ChatGPT being asked for ideas on how to transform the existing company via the housing legislation. The frequent use of “it is not” is a structural give-away of ChatGPT’s preferred language structure (for example, “This paper is intended to provide a framework and working document for our management meetings, not as a one-time briefing.” Who really needs the clarification?). The white paper also uses inconsistent tone by switching from Lemonis giving directives to his management to a royal we declaring the company’s collective intentions and conclusions. For example, the document goes Lemonis exhorting “our management should understand this document as a call to action” to the section-by-section review of the legislation declaring “we see this as a signal that federal policy is willing to evaluate building code models that may reduce cost and increase density.”
Regardless of whether Lemonis over-engineered this white paper with ChatGPT, I am highly skeptical in the plan. The company will need to dedicate significant resources to these plans. The kind of transformation described in the document requires new hires, new teams, and perhaps major reorganizations. These bold plans are difficult to pull off even for highly successful companies. Proof positive will come from clear investments in relative initiatives and clear progress on the three pilots described in the following 12-month roadmap:
“Within twelve months, management aims to have at least three pilots in the market. The first is expected to be a Neighborhood Intelligence municipal or developer pilot using neighborhood scorecards, public land/infill mapping, and housing demand analytics. The second is expected to be a Home Value Guide consumer pilot connected to renovation ROI and home services. The third is expected to be a Beyond Home Services repair or renovation pilot targeted at aging housing stock, affordable homeownership, or disaster recovery. By the end of the first year, the company should also have formal partnerships or active discussions with community banks, credit unions, modular builders, manufactured housing operators, municipalities, housing authorities, and service provider networks. The goal is not to chase every provision in the Act. The goal is to advance a disciplined operating system that turns housing market fragmentation into an integrated business model.”
[weekly chart of BBBY]
Spotlight on Mortgage Rates
The Mortgage Bankers Association (MBA) reported two weeks with a decrease in mortgage applications and two weekly decreases for the month of June. For all of May, new home purchase mortgage applications increased 3.8% year-over-year but dropped 3% sequentially (not seasonally adjusted).
Mortgage rates remained relatively stable in June after increasing rapidly in May as inflationary pressures in the economy took their toll on bond yields. I expect May’s heightened rates to soften both new and existing home sales, but only new home sales showed an impact.
![Freddie Mac, 30-Year Fixed Rate Mortgage Average in the United States [MORTGAGE30US], retrieved from FRED, Federal Reserve Bank of St. Louis; June 29, 2026.](https://drduru.com/onetwentytwo/wp-content/uploads/2026/06/20260629_30-Year-Fixed-Rate-Mortgage-Average.png)
Be careful out there!
Full disclosure: long ITB and short a call option