

Housing Market Intro and Summary
What happened in the housing market for July, 2025? The housing data looked as bad as ever, but the stock market has finally responded favorably to the stocks of home builders. This forward-looking display of “green shoots” forms the basis of a “bearish to bullish reversal.” The catalyst for this change in market sentiment is less about good news and more about news that is not as bad as feared. In my last Housing Market Review I formally noted the foregone conclusion of a disappointing spring selling season. The latest data put an exclamation point on that end, and now markets can start to imagine spring representing something “close enough” to the worst case market conditions in the current economic conditions.
- The stocks of home builders surged in sympathy with a strongly favorable reaction to earnings from D.R. Horton and PulteGroup. Despite lack of further progress, the gains confirmed a bearish to bullish reversal is underway.
- Home builder sentiment scraped itself off the recent lows but still looks set to challenge the pandemic low.
- Single-family housing starts resumed a decline while building permits continued to drop to fresh 2-year lows.
- Sales of new single-family homes dropped closer to the lower bound of a multi-year range. This range must remain intact to maintain the momentum of the bearish to bullish reversal.
- Existing home sales fell back to levels last seen in September, 2024 with the median price hitting the anticipated new all-time record.
- Sales in California’s existing home market finally experienced another positive month but recent momentum still points to a soft July.
- The homeownership rate continues to decline.
- Builder CEO claims that Census housing data is unreliable.
- The top 10 builders further concentrated market power in 2024.
- Mortgage rates slightly rebounded after mid-July.
Housing Stocks
The iShares US Home Construction ETF (ITB) is finally unfolding a bearish to bullish reversal, but the journey promises to stay choppy and at times tepid. I have predicted and tracked the weakness in the housing market and home builder stocks for some time now, and it seems, all else being equal, the news will not worsen in the short to intermediate term. Absent, an economic slowdown, the stocks of home builders are primed to rally higher into a vacuum of no worse news.
Last week (on July 22nd), ITB gained 7.9% thanks to an extremely positive post-earnings reaction to major builders D.R. Horton (DHI) and PulteGroup (PHM). These stocks gained 17.0% and 11.5% post-earnings and printed convincing breakouts above their 200-day moving averages (DMAs) (the blue line in the chart). While neither stock has made further progress since then, and thus neither has ITB, these gains imply a significant shift in sentiment as neither builder reported particularly good earnings. Both builders, like the rest of the housing market, are still facing tough choices in determining how much margin to give up to maintain sales volumes while maintaining strong balance sheets to assure analysts and motivate investors.
")
As I predicted in my Seeking Alpha article on the bearish to bullish reversal, the outsized gains in DHI and PHM drained a lot of buying enthusiasm from the rest of the builders who subsequently reported earnings. Here is a summary of post-earnings performance and current technical positioning:
- July 23: Taylor Morris Homes Corporation (TMHC), -3.8% post-earnings; false 20DMA and 200DMA breakouts, support holding at 50DMA.
- July 23: M/I Homes (MHO), +0.5% post-earnings; failed at 200DMA resistance, down since earnings.
- July 24: Meritage Homes (MTH), -5.0% post-earnings; failed at 200DMA resistance, holding 50DMA support.
- July 25: Century Communities (CCS), -5.8% post-earnings; below 20DMA, above 50DMA.
Without the context of the reaction to PHM and DHI earnings, this list hardly looks like a bearish to bullish reversal. In each case, the earnings were relatively similar, but the surprise of “not so bad” earnings reports has already worn off. Now, the builders need a generally supportive stock market environment to continue the bearish to bullish reversal. I would buy into each of these dips if I did not already have my fill of home builder stocks ahead of October which is the start of the seasonally strong period for these stocks. In the meantime, I am bracing myself for a little more retrenchment as the stock market trudges through its most dangerous months of the year (August to September).
Housing Data
Home Builder Confidence: The Housing Market Index – July, 2025
The National Association of Home Builders (NAHB)/Wells Fargo Housing Market Index (HMI) took a small break from declining to new lows. June’s 2-point decline took the HMI to its 3rd lowest level since 2012. July’s HMI increased by 1 point to 33. The pandemic-driven low of 30 still seems within reach by the fall. The NAHB attributed the small jump to the extension of 2017 tax cuts from the recent budget bill. However, the builder organization cautioned that “elevated interest rates and economic and policy uncertainty continue to act as headwinds for the housing sector.” Compare this caution to June’s warning that “buyers have increasingly moved to the sidelines due to elevated mortgage rates and tariff and economic uncertainty.”
Two of the three HMI components increased. Consistent with June’s warning, the “Traffic of Prospective Buyers” component fell to a new two year low even as the “SF Detached Next Six Months” component, a measure of sales expectations, jumped 3 points back to April’s level. The “Single Family: Present” component increased by 1 point. With a 13th straight month of HMI measuring below 50% (negative territory) all these components are near the pandemic low. As part of the bearish to bullish reversal, I am assuming sentiment will not break the pandemic low.
/Wells Fargo Housing Market Index (HMI) and the University of Michigan Index of Consumer Sentiment")
Source for data: NAHB and the University of Michigan
Consumer sentiment edged up alongside builder sentiment.
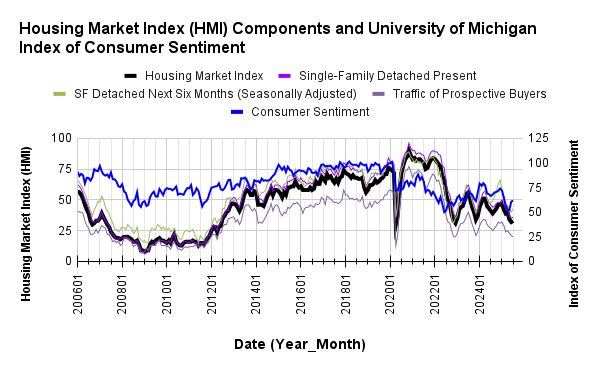
Pricing power declined for builders once again. The 38% share of builders cutting prices is the highest level on record over the short time the NAHB has collected data (since 2022) and surpasses June’s 37% record-setting share.. The share of builders providing incentives stayed flat with June at 62% while the average price discount was also flat at 5%, the same since November, 2024.
While HMI only increased by a point, three of four regions experienced significant gains. The Midwest led the way with a 5 point gain to 44 and a tie for high of the year. The Northeast increased by 4 points and returned to March’s level. The West jumped off a 13+ low with a gain of 3 points to 25. The South demonstrated its oversized influence on the index by declining for a 7th straight month and holding the overall HMI’s gain to 1 point. The one point loss took the South to a new 13-year low. The South needs to bottom out at these extremes to help catalyze the bearish to bullish reversal.
New Residential Construction (Single-Family Housing Starts) – June, 2025
With a downward revision for May, single-family housing starts have now failed to rise sequentially for 4 straight months. June starts fell 4.6% from May and plunged 10.0% year-over-year.
![US. Bureau of the Census, Privately Owned Housing Starts: 1-Unit Structures [HOUST1F], first retrieved from FRED, Federal Reserve Bank of St. Louis, July 20, 2025](https://drduru.com/onetwentytwo/wp-content/uploads/2025/07/20250720_Housing-starts-June-2025.png "Housing starts")
In further confirmation of sinking home builder sentiment and subdued future prospects, building permits continue to trend downward. Permits fell to a fresh 2-year low in June with a 3.7% drop from May and an 8.4% plunge from a year ago. The decline in starts and permits combined with the downtrend in sentiment symbolize a housing market still mired in a slowdown.
For the second month in a row, the Midwest was a notable regional exception to the year-over-year declines in starts. The Northeast, Midwest, South, and West each changed -5.7%, +18.8%, -18.5%, -3.0% respectively year-over-year.
New Residential Sales (Single-Family) – June, 2025
New home sales barely budged sequentially but declined significantly year-over-year thanks to sales tumbling in three of four regions. These declines put an exclamation point on the weak spring selling season. Sales increased 0.6% from an unrevised May sales figure of 623K to 627K in June. Year-over-year sales declined 6.6%. This range needs to hold firm to support the bearish to bullish reversal for the stocks of home builders.
![US. Bureau of the Census, New One Family Houses Sold: United States [HSN1F], first retrieved from FRED, Federal Reserve Bank of St. Louis, July 28, 2025](https://drduru.com/onetwentytwo/wp-content/uploads/2025/07/20250728_New-home-sales-June-2025.png "new home sales")
For June, the median price for new homes dropped sharply 4.9% sequentially and dropped 2.9% year-over-year to $401,800. I assumed a price range between $400,000 and $440,000 would hold, but this sudden drop toward the bottom of the range now has me wondering how much of the pandemic-driven price gains may get rolled back. There have only been two lower points since August, 2021. As with many of the prior swings, June’s price swung with notable changes in sales mix. As long sales hold up with lower prices, the bearish to bullish reversal should remain intact.
New single-family homes shifted sharply into the $300,000 to $499,999 range with even the sub $300,000 range losing share. The last 2 months have gone from the high to the low of the recent range of share for the lowest price tier. I am not sure yet what to make of these large shifts. The over $1M segment held its share and has been the most stable of the price tiers.
The NAHB recently examined the distribution of sales for new single-family homes across price tiers from 2020 to 2024 and observed a dramatic shift: “Homes priced under $300,000 experienced a 65% decline in sales, while sales of homes priced between $300,000 and $399,999 fell by 10%. In contrast, higher-end segments saw substantial growth, with sales of homes priced between $800,000 and $999,999 more than doubling and those priced at $1,000,000 or more increasing by 85%.” Even the Midwest and the South, two regions where buyers have fled for cheaper housing have seen big share declines for lower-priced homes: “In 2020, more than half of the new homes sold in the Midwest and South were priced under $300,000. By 2024, that share had plummeted to just 16% in the Midwest and 23% in the South.”
May’s inventory was revised upward from 8.9 months of sales to 9.7. June’s edged higher to 9.8 months of sales. For comparison, a year ago inventory sat at 8.4 months of sales. Absolute inventory continued its sharp uptrend toward an 18-year high and what now looks like a challenge to the all-time high from the peak of the housing bubble in 2006. Of course this time inventory is creeping higher from a slow market and tight existing home inventories. Still, in April, the NAHB finally got more wary about these ballooning inventory numbers. From its report on June’s new home sales:
“Challenging affordability conditions, elevated interest rates and economic uncertainty continue to act as headwinds on the housing sector as many potential buyers continue to stay on the sidelines…As expected, the combined new and existing total months’ supply has risen over the last few months to a balanced 5.4 months due to continued buyer hesitation in both new and existing home sales markets. Elevated mortgage rates and sustained price levels continue to limit purchasing power, particularly among first-time and middle-income buyers.”
The NAHB has transitioned from recent concern over rising inventory levels to calling the total inventory situation “balanced.” Recall that the NAHB cautioned two months ago that “the market will face notable inventory impacts on production as this measure approaches 5.5.”
The Midwest was the only region to lose sales year-over-year in June. The Northeast, Midwest, South, and the West changed -34.4%, +9.0%, -4.4%, -14.4% respectively year-over-year. On a month-over-month basis, the South experienced some relief with a 5.1% gain.
Existing Home Sales – June, 2025
Just as declining new home sales put an exclamation point on the bust for the spring selling season, existing home sales planted their own exclamation point with a roundtrip toward levels seen last in September, 2024. While May sales made a tepid attempt at a sequential rebound with a 1.0% increase (revised upward), a 2.7% sales decline from May to June resumed the decline. Sales were flat year-over-year. The National Association of Realtors (NAR) made its case for lower mortgage rates in order to boost the market by calculating that “if the average mortgage rates were to decline to 6%, our scenario analysis suggests an additional 160,000 renters becoming first-time homeowners and elevated sales activity from existing homeowners.”

(For historical data from 1999 to 2014, click here. For historical data from 2014 to 2018, click here) Source for chart: National Association of Realtors, Existing Home Sales© [EXHOSLUSM495S], retrieved from FRED, Federal Reserve Bank of St. Louis, July 29, 2025

Perhaps responding to weak demand, perhaps marking an official end to the spring selling season, sellers finally put a pause on additions to inventory. Inventory jumped in May by 6.2% from April but dropped slightly 0.6% from May to June for 1.53M unsold homes. According to the NAR, there is a “4.7-month supply of unsold inventory, up from 4.6 months in May and 4 months in June 2024.” The months of supply has now increased for six straight months while the 5-month streak of increases ended for absolute inventory.
Pricing pressures continue no matter the changes in inventory. The median sales price of an existing home increased 2.7% from May to June and 2.0% year-over-year to $435,300. This 24th straight year-over-year increase took the median price to a new record as I anticipated. I saw several articles in the media helping readers to understand how prices set records while the housing market is in the throes of a slowdown. Anyone watching the market (or reading this blog) knows the familiar refrain of limited inventories for the motivated buyers and demotivated sellers “locked” into mortgage rates much lower than prevailing market rates. However, both dynamics will soon change as inventories steadily move higher (the NAR reluctantly acknowledges “temporary oversupply” in some markets).
The NAR took this opportunity to applaud the relentless price increases even as it lamented an affordability problem caused by high mortgage rates: “The record high median home price highlights how American homeowners’ wealth continues to grow—a benefit of homeownership. The average homeowner’s wealth has expanded by $140,900 over the past five years.” My bet is that lower mortgage rates from current levels will only spur demand that keeps current prices elevated or drives them even higher.
The average time on the market for an existing home was unchanged from May at 27 days. The year-over-year increase from 22 days characterizes the sluggish market.
The share of sales going to first-time home buyers remained flat with May at 30%, up 29% from a year ago. Any relative increase in the share of first-time home buyers is a surprise to me given the context of poor affordability. The NAR’s 2017 Profile of Home Buyers and Sellers reported an average of 34% for 2017, 33% for 2018, 33% for 2019, 31% for 2020, 34% for 2021, 26% for 2022, 32% for 2023, and a plunge to an all-time low of 24% in 2024.
The regions were evenly split in year-over-year sales changes. The regional year-over-year changes were: Northeast -4.2%, Midwest +2.2%, South +1.7%, West -4.7%.
Single-family existing home sales decreased 3.0% from May to 3.57M in June and increased by 0.6% year-over-year. The median price of a single-family home was $441,500, up 2% year-over-year and up 3.0% month-over-month.
California Existing Single-Family Home Sales – June, 2025

While national existing home sales roundtripped, California’s existing sales experienced a monthly rebound rare for this year (albeit from low levels). Still, the California Association of Realtors (C.A.R) called the current market “stagnant.” Pending sales fell year-over-year for the seventh straight month, pushing C.A.R. to predict a “soft” July. C.A.R.’s president remained hopeful for a rebound in the second half of the year.
June sales of California’s existing single-family homes increased 4.0% from May to 264,260 and decreased 0.3% year-over-year. The median price fell slightly 0.1% month-over-month and year-over-year to $899,560. The median price per square foot fell year-over-year for the second straight month, this time falling from $440 to $437. In its previous report, C.A.R. named a (surprisingly) wide variety of drivers of May’s minor price decline: “…including elevated interest rates, insurance availability/affordability, economic uncertainty and home sellers’ willingness to reduce prices.” All these factors likely held for June except the last one. The sales-price-to-list-price ratio finally fell from 100% to 99.3%. I believe this is the first decline, at least below 100%, in over a year.
The supply of housing as expressed in listings finally hit a small speedbump. June’s unsold inventory index (UII), which measures the number of months needed to sell the supply of homes on the market at the current sales rate, stayed flat with May at 3.8, up from 3.0 a year ago. Total active listings increased 40% year-over-year (in May it was 50%) for a 68-month high and a 17th straight year-over-year increase. New active listings made a sudden drop with its first decline in 6 months, down 10.2% from May and 5.0% year-over-year. So far so good for C.A.R.’s prior prediction for a slowdown in the growth rate in new active listings leading to “a plateau sometime in the next two months.”
The median time on market increased from 21 in May to 24 in June, up from 18 a year ago.
Home closing thoughts
The Homeownership Rate Continues to Decline
I do not quite know what to make of small changes in the homeownership rate because the surge to the peak in 2004 at 69.2% was part of an historic housing bubble and mania. What may be more important to note is that the rebound from a historically low homeownership rate in 2015 is grinding to an end. The NAHB used numbers from the Census’s Housing Vacancy Survey (HVS) to conclude that the homeownership rate fell for the three age groups below 55 years old and hit an overall 65%. This rate sits below the 2023 peak of 66% and the 25-year historic average of 66.3%. Given the size of the previous housing bubble, I expect the homeownership rate to continue to “normalize” at lower levels.
The NAHB called this normalization a “warning” given the context of the current housing slowdown. I will not worry unless the homeownership rate continues to drop below 64%, a move which would mark an official end to the recovery in the homeownership rate.
Is the Census New Home Data Unreliable?
I perked up while reading the transcript of the Q2 2025 earnings conference call for M/I Homes (MHO). In a surprisingly bullish earnings call, the CEO claimed that the census data on builders is dated and unreliable. An analyst first asked “..do you guys respond to the census data requests because I know many of the other public builders actually don’t respond to those. Do you guys provide data to the census?” The chairman, CEO, and president Robert Schottenstein responded “I don’t know that we do. If we do, I’m not aware of it. I’ll have to check that. I actually don’t pay that much attention to a lot of that data because it’s so dated, and I’m not sure how reliable it is.”
Duly noted!
Tiny Homes As An Answer to Affordability Problems?
In the latest piece offering tiny homes as a solution to affordability issues, Marketplace showcased a project in Baltimore called Hope Village as a “path to homeownership.” This community is just 13 homes, but it provides shelter for the previously unhoused. When looking at these 400 square units, I actually wonder why tiny tonwhomes or condos would not have been cheaper and more efficient. It is also not clear that these homes are pathways to affordable living given the $200,000 homes came fully furnished and were sold for just $25,000. The main donors to this project got the idea during a trip to Nigeria: “Chris, a former marine insurance adjuster, came up with Hope Village during a work trip to Nigeria, where he noticed long rows of container homes.”
Home Building Becomes Even More Concentrated
On the other end of the spectrum from tiny homes are the top ten builders whose share of the market keeps rising. The NAHB recently reported that “The top ten builders captured a record 44.7% of all new U.S. single-family home closings in 2024, up 2.4 percentage points from 2023 (42.3%).” The share of closings accelerated during and coming out of the pandemic. This uptrend looks like it will continue as consolidation helps builders lower costs by getting better deals from suppliers and improved leveraging of capital. The top ten builders only owned about 10% of market share in 1990.
Spotlight on Mortgage Rates
The Mortgage Bankers Association (MBA) reported 3 weeks of increases in mortgage applications and one weekly decrease for the month of July. The 23-month streak of strong year-over-year performances in new home mortgage purchase applications came to an end in January with a 6% decrease, and continued their decline with another 6.9% decline in February. March delivered a fresh rebound with a 5.5% year-over-year increase in mortgage applications. April continued the fresh momentum with a 5.3% year-over-year increase in mortgage applications. May ended the momentum with a 4.5% year-over-year decline in mortgage applications to a three-month low. Finally, mortgage applications in July soared 8.5% year-over-year but fell 4% from May (not seasonally adjusted). The MBA’s projection of 667K new single-family home sales came in significantly higher than the 627K actual.
Mortgage rates stopped trending lower with a jump to 6.7% in the third week of July. I remain cautious about the impact of a more dovish Federal Reserve on long-term rates. Again, recall that last year’s Fed rate cuts into a strong economy moved bond markets to send long-term yields higher). By all accounts, the U.S. economy remains as resilient as ever.
![Freddie Mac, 30-Year Fixed Rate Mortgage Average in the United States [MORTGAGE30US], retrieved from FRED, Federal Reserve Bank of St. Louis; July 29, 2025](https://drduru.com/onetwentytwo/wp-content/uploads/2025/07/20250729_30-Year-Fixed-Rate-Mortgage-Average-in-the-United-States.png)
Be careful out there!
Full disclosure: long ITB, long LEN call spread, long CCS, long TMHC
1 thought on “What Happened in the Housing Market – Bearish to Bullish Reversal”