Stock Market Commentary
The stock market’s fearless streak met fresh geopolitical headwinds that significantly raised the risk quotient. Tensions surged as Israel bombarded Iran’s nuclear infrastructure and Iran retaliated, spiking oil prices and triggering a market sell-off that, while sharp, could have and should have been a lot worse. This fresh market risk is a reminder that complacency, especially when married with overbought trading conditions, can only last so long. However, the stock market as a whole remains well-supported, so I am not changing my bullish posture…even as I take some precautions. (A friend predicted that Iran’s repressive regime will fall soon. If he is correct, I fully expect a massive rally in the stock market in response).
In parallel to rapidly developing news in domestic politics and geopolitical tensions, the market will contend with another Federal Reserve meeting and a trading week shortened by the Juneteenth holiday on Thursday.
The Stock Market Indices
S&P 500 (SPY)
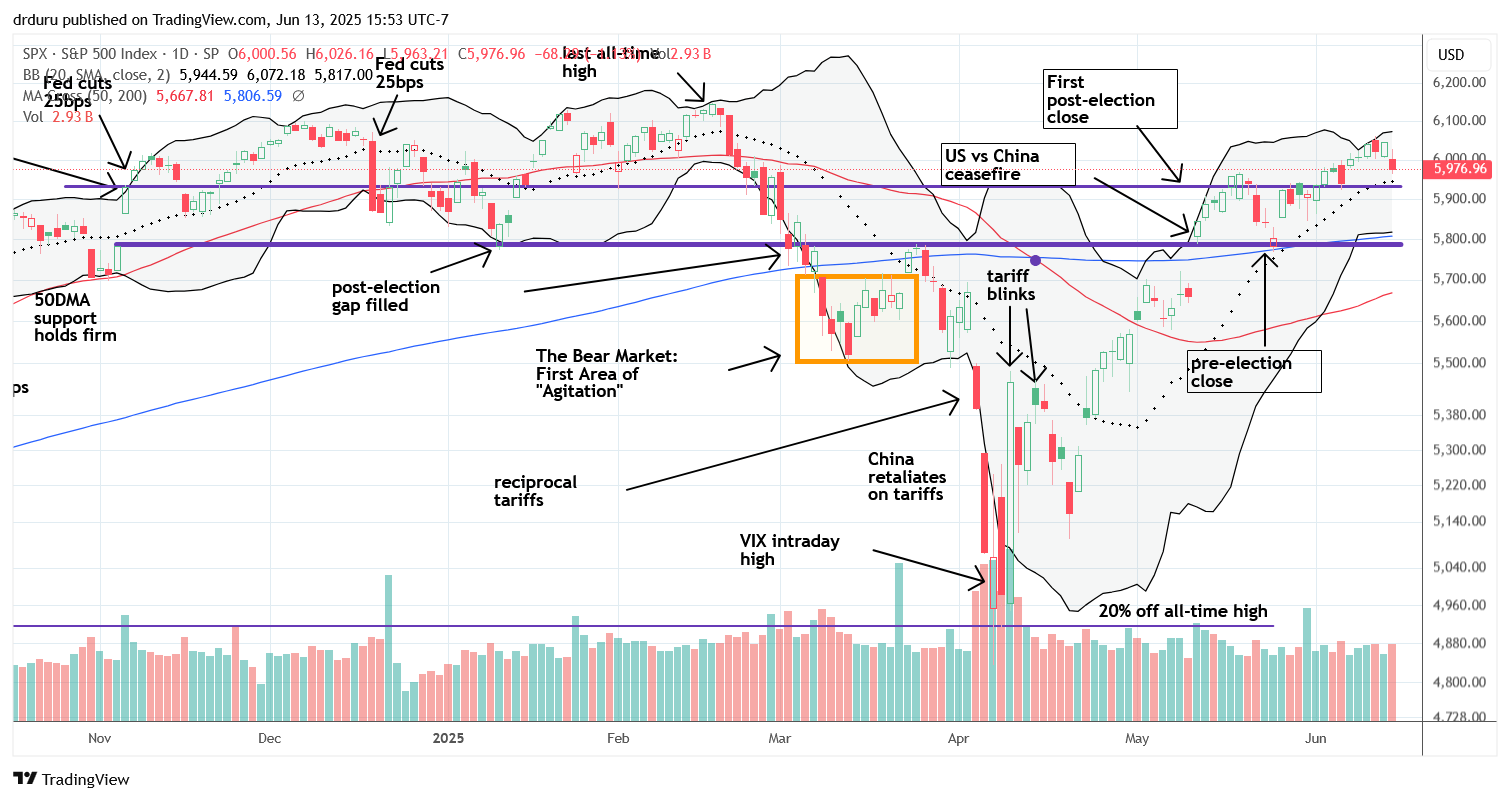
The pullback for the S&P 500 was mild, all things considered, at 1.1%. Key support lies near 5941 at the 20-day moving average (DMA) (dotted line) (soft pullback scenario), around 5800 at the 200DMA (blue line) (medium bad case), and approximately 5675 at the 50DMA (“worst” case for this bull market). If the S&P 500 falls below its 50DMA, I will reassess market sentiment.
NASDAQ (COMPQ)
The NASDAQ appears more definitively topped out, failing to challenge its all-time high. A test of the uptrending 20DMA is imminent, but the tech laden index also remains well supported, mirroring the S&P 500’s resilience.

iShares Russell 2000 ETF (IWM)
IWM came within a hair of 200DMA resistance before retreating to its 20DMA. I missed a potential buying opportunity on Friday. Again, since I maintain a large core position in shares, I never hate seeing IWM zip upward. I now brace for IWM to retest support at its 50DMA, a test the ETF of small caps missed last month.

The Short-Term Trading From Fragile to Fearless
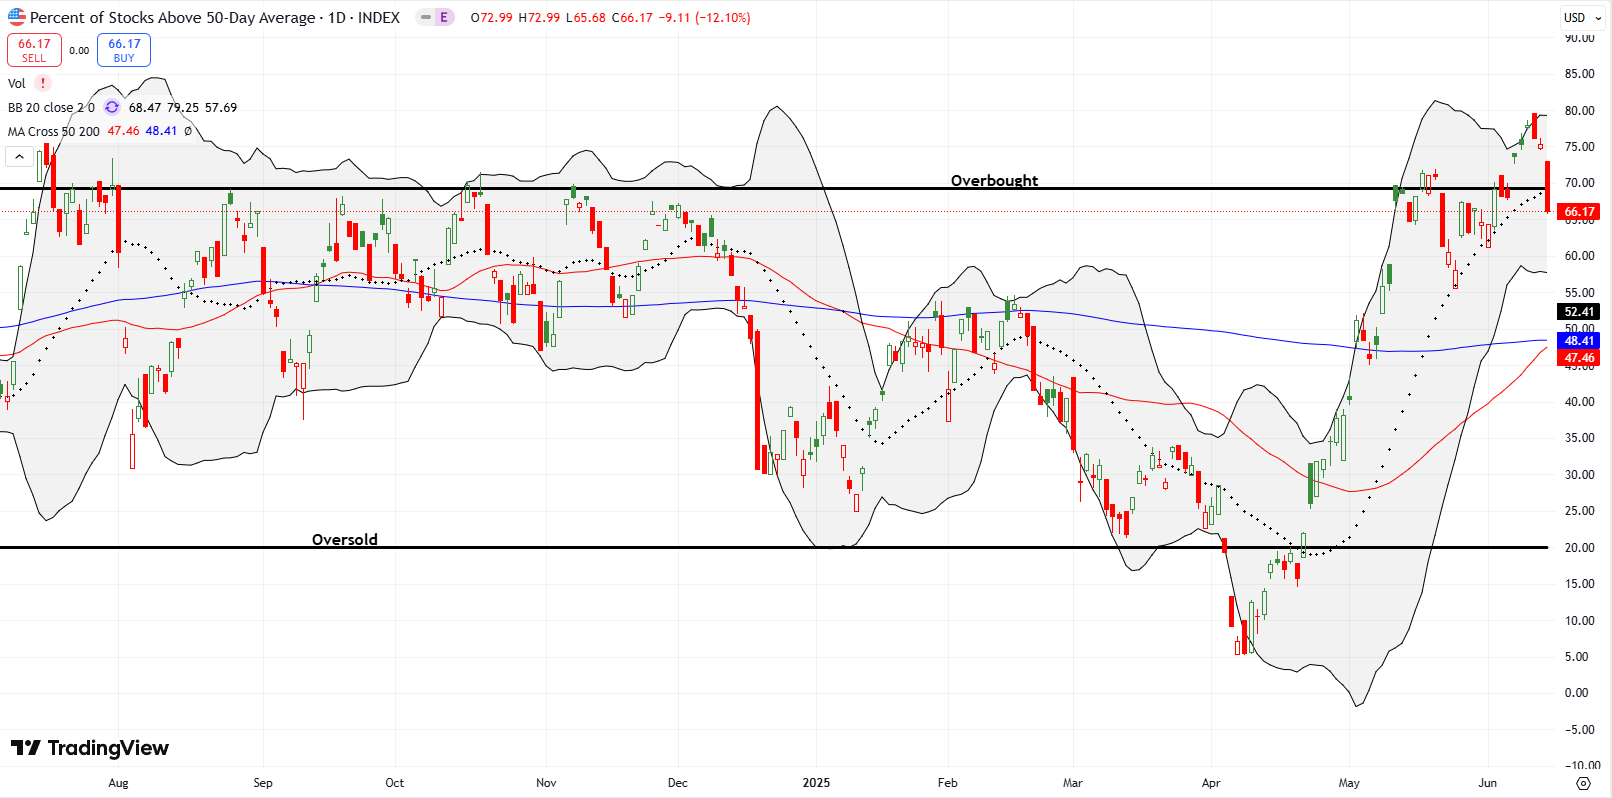
- AT50 (MMFI) = 66.2% of stocks are trading above their respective 50-day moving averages (first overbought day)
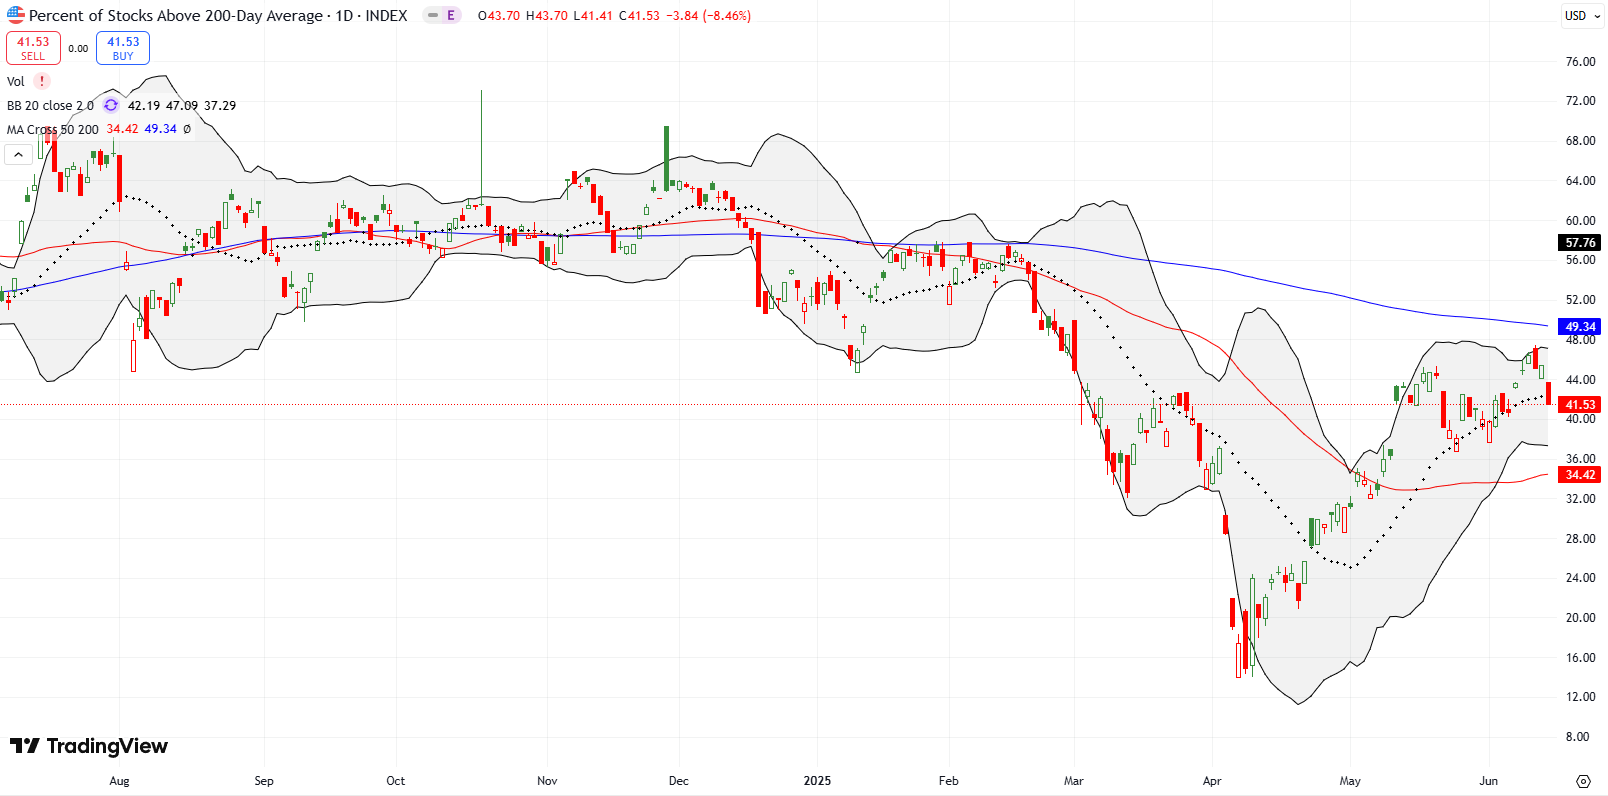
- AT200 (MMTH) = 41.5% of stocks are trading above their respective 200-day moving averages
- Short-term Trading Call: cautiously bullish
AT50 (MMFI), the percentage of stocks trading above their respective 50DMAs, closed at 66.2% after spending 5 days in overbought territory, above the 70% threshold. According to my AT50 trading rules, this breakdown delivers a bearish signal. However, due to solid support across indices, I am not stepping away from my cautiously bullish short-term trading call. If the S&P 500 closes below its first support level, the still converged 20DMA and the first post-election close, I will likely downgrade to neutral. A further breakdown below the 200DMA will make me bearish regardless where AT50 closes at the time. I do not want to react as slowly as I did with the last 200DMA breakdown.
Meanwhile, AT200 (MMTH), the percentage of stocks trading above their respective 200DMAs, broke out to a new high but remains far from its 2025 and 2024 peaks. It has not fully healed from the market trauma earlier this year. While the breakout above the trendline is promising, the overarching downtrend is still intact.
The Volatility Index (VIX)
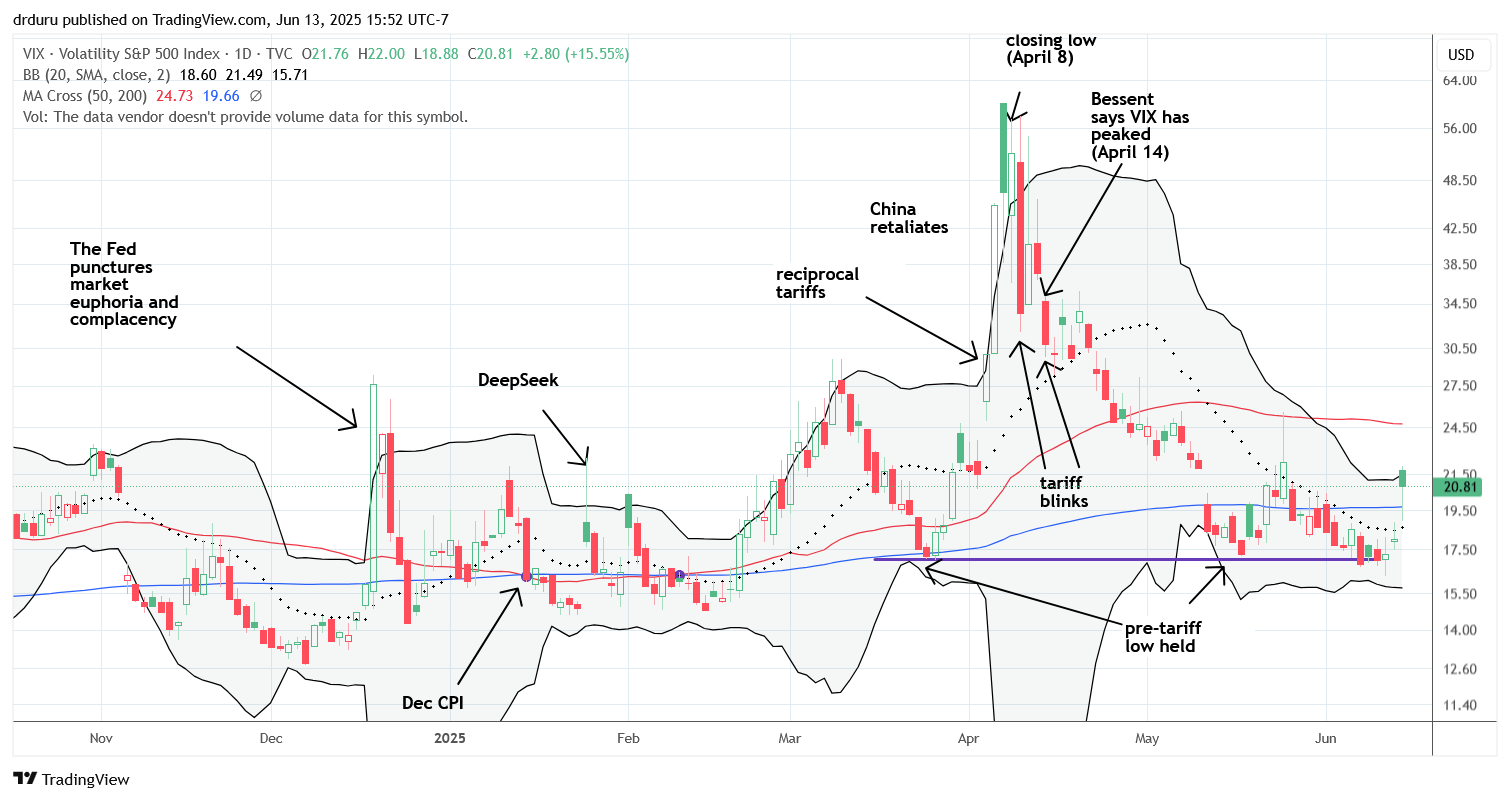
The VIX sharply bounced off its critical 17 support and closed the week at 20.8, “elevated” territory. My slow reaction to the VIX’s bearish behavior last week motivates me to respond quickly if the S&P 500 cracks 200DMA support. After holding support for the first three days of the week, the VIX gained 4.4% on a market up day; Thursday alone should have been an instant alarm. While I did buy a $SPY 560/540 put spread on Thursday, I was not responding to the clear and present danger of the VIX. Instead, I felt my trading account needed a fresh “emergency” backstop.
The Equities: Fresh Market Risk
United States Oil Fund (USO)
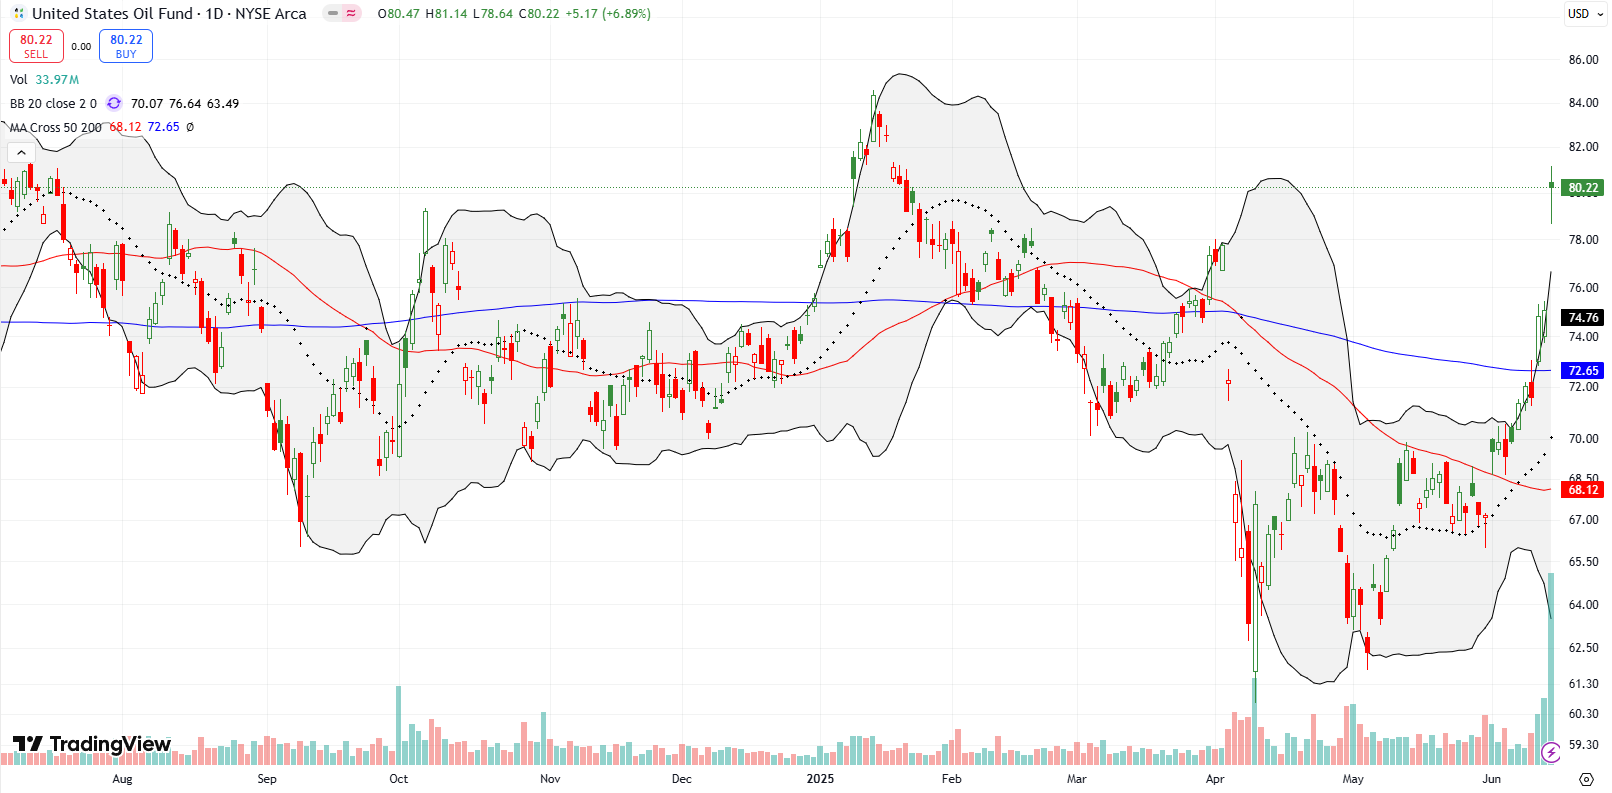
Like the VIX, USO tried to warn us about short-term trading action. The oil ETF signaled strength ahead with a 50DMA breakout, a steady climb along its Bollinger Band (BB), and even a strong 200DMA breakout. In response to Israel’s bombardment and Iran’s retaliation, USO surged 6.9% on Friday. However, given the extreme nature of Friday’s move, well above the upper BB, I faded USO with a July $74 put. I want to give sufficient time for the near inevitable pullback to play out. I will also add to my position on another push higher for USO.
Fluor Corporation (FLR)
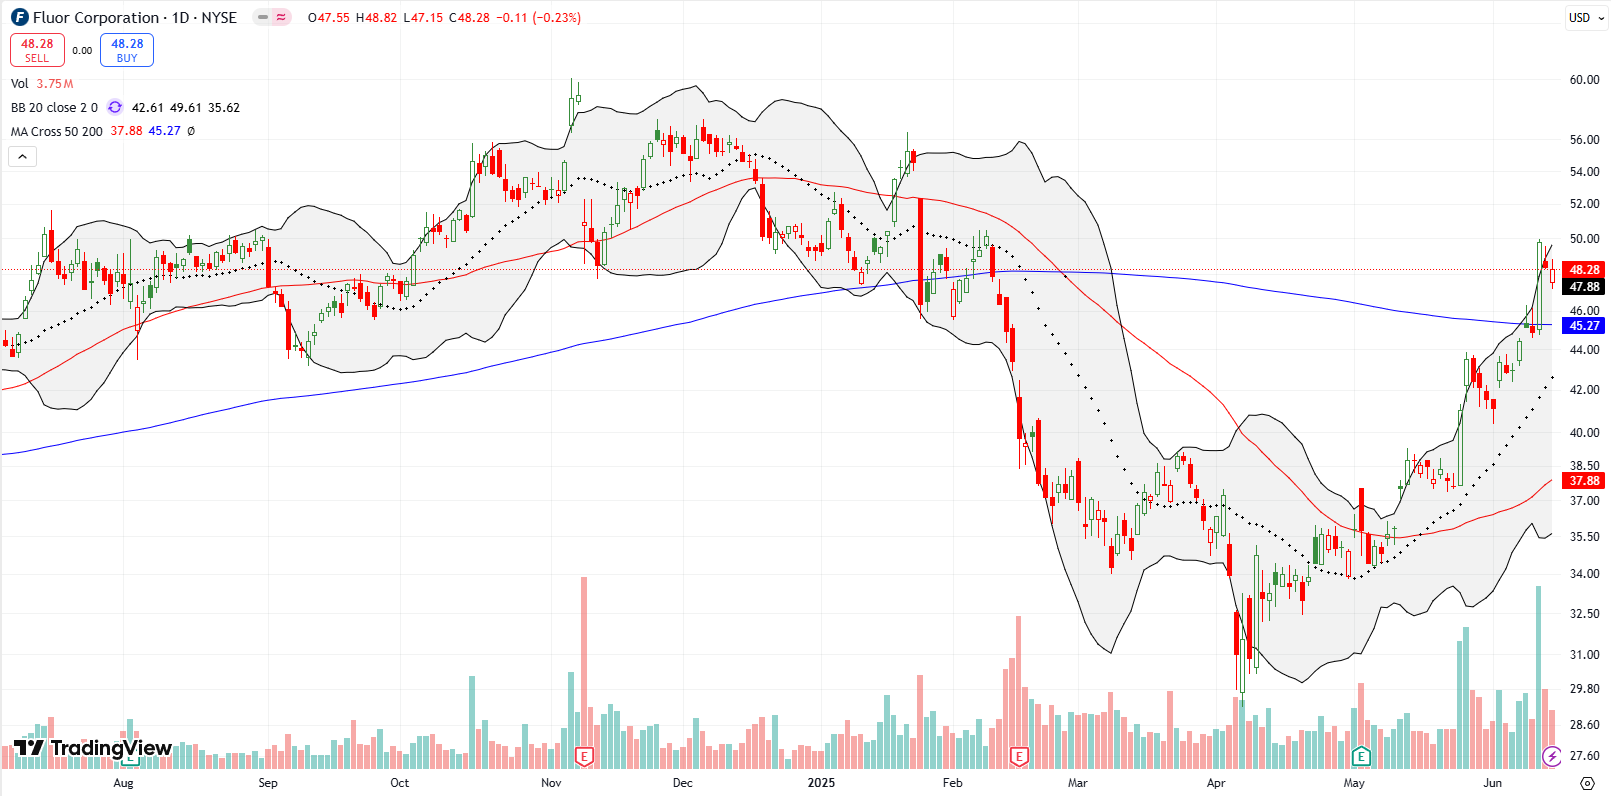
FLR finally broke out above its 200DMA, validating my earlier bullish expectations tied to infrastructure and AI data center buildouts. I plan to add to my position on a retest of 200DMA support.
Roblox (RBLX)
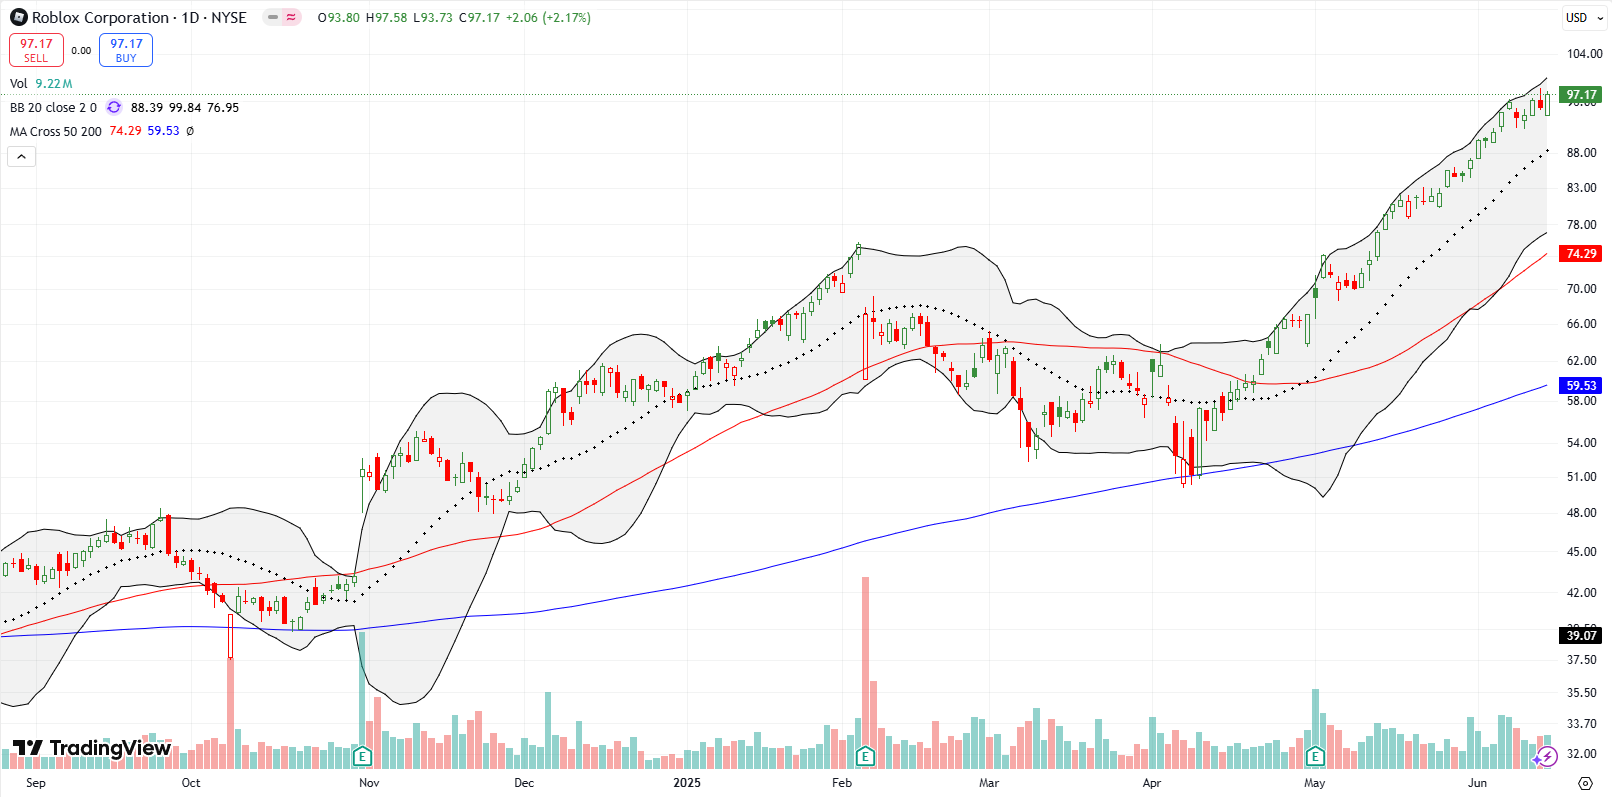
Gaming software platform Roblox (RBLX) maintained a strong uptrend that started with a convincing test of 200DMA support at the trough of the tariff drama, trauma, and noise. I remain sidelined as RBLX has yet to test 20DMA support; I am not one to chase unadulterated momentum.
Etsy (ETSY)
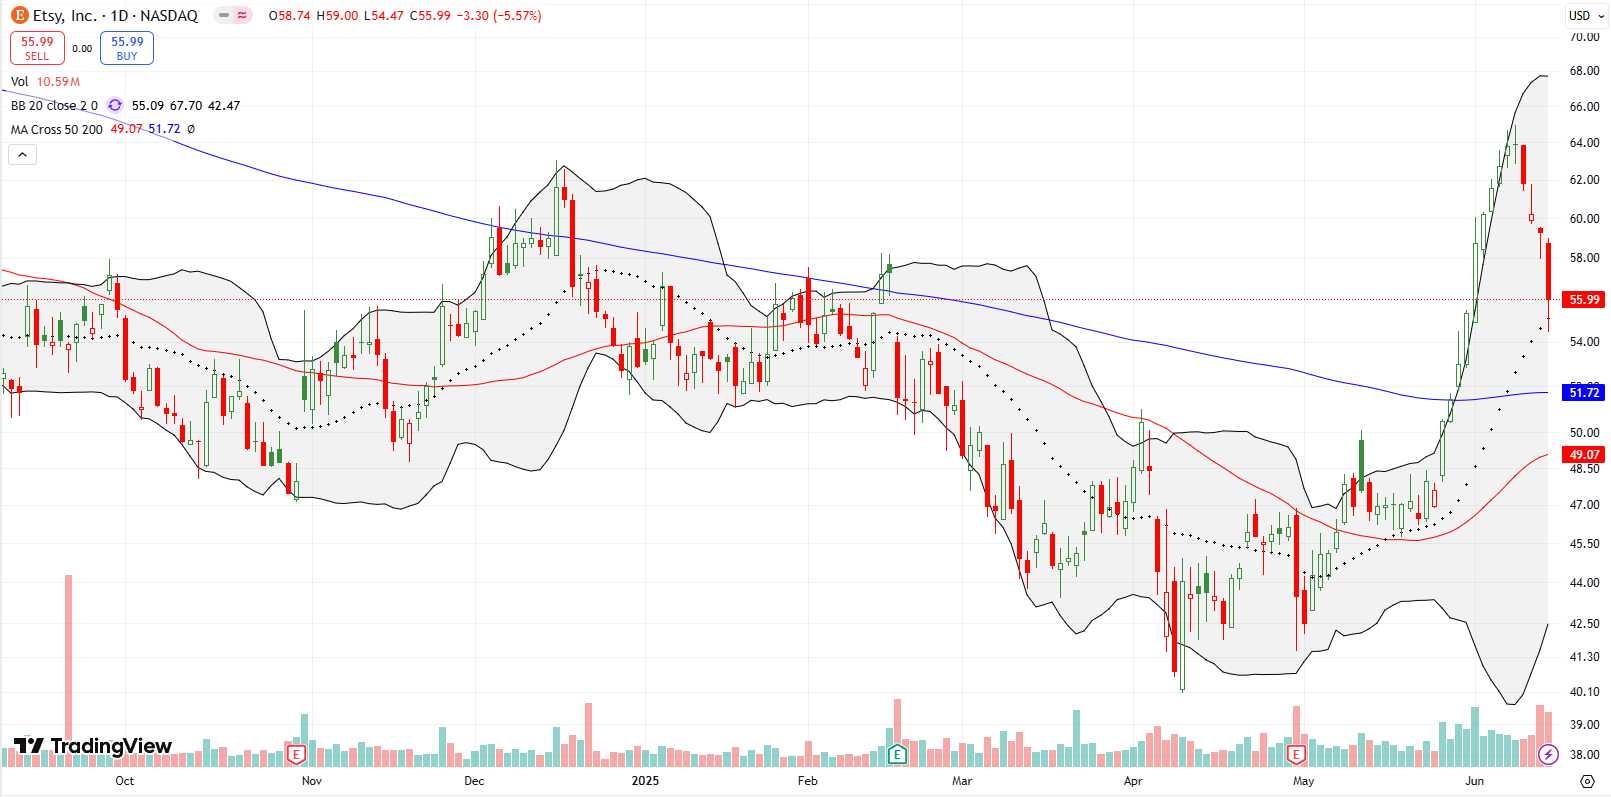
I made a rare exception on my anti-chasing rule when I bought a low risk $65 calendar call spread on ETSY. ETSY’s move was even more overheated than RBLX as ETSY closed above its upper BB for six days in a row. And then suddenly ETSY reversed downward even more sharply. In just 4 trading days, ETSY plunged 17% after a small rebound off 20DMA support. If 20DMA support holds with a higher close, I will start to buy shares, assuming that the earlier run-up remains meaningful even if premature.
Let ETSY be a lesson and reminder about the dangers of chasing upward momentum!
Celsius Holdings (CELH)
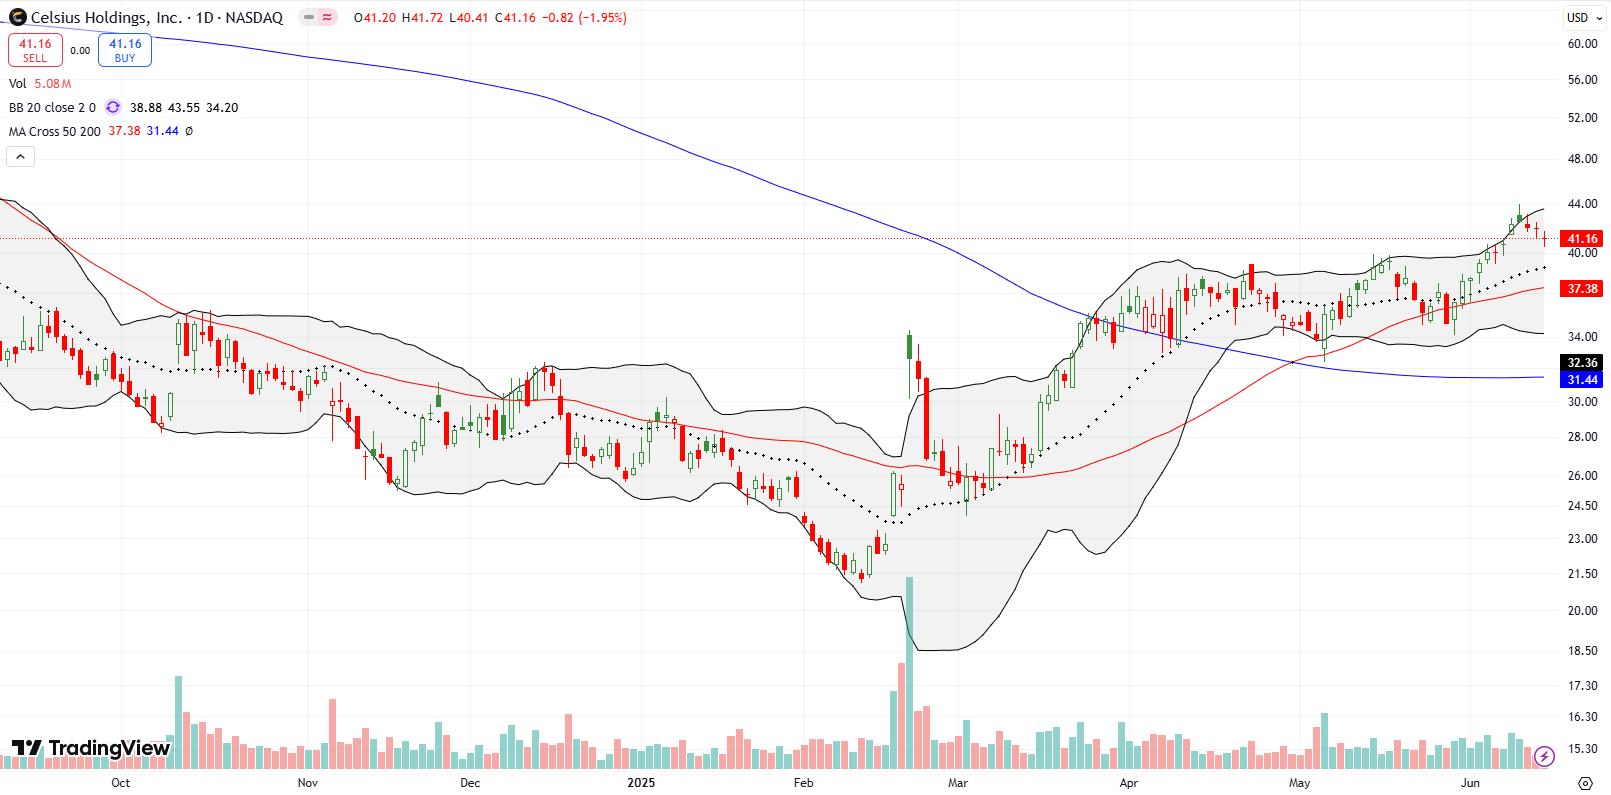
Energy drink company CELH reversed from bearish to bullish since reclaiming its 200DMA as support in March. I am watching for a test of the 20DMA or 50DMA support as potential buy points.
International Business Machines (IBM)
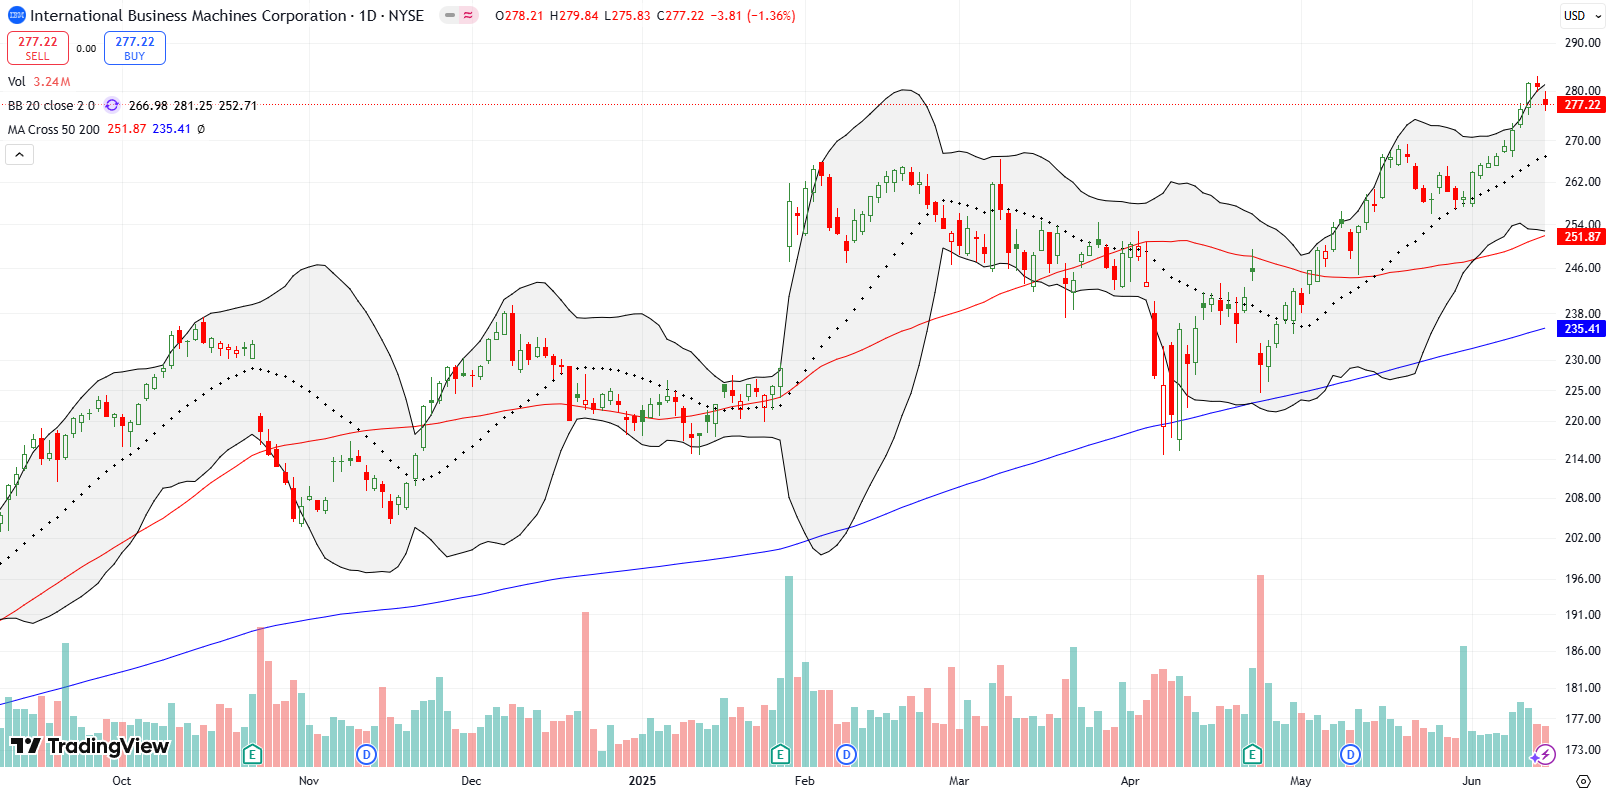
IBM made a near parabolic move to all-time highs last week, driven by progress with its quantum computing technology. I am watching for the next test of 20DMA support before buying.
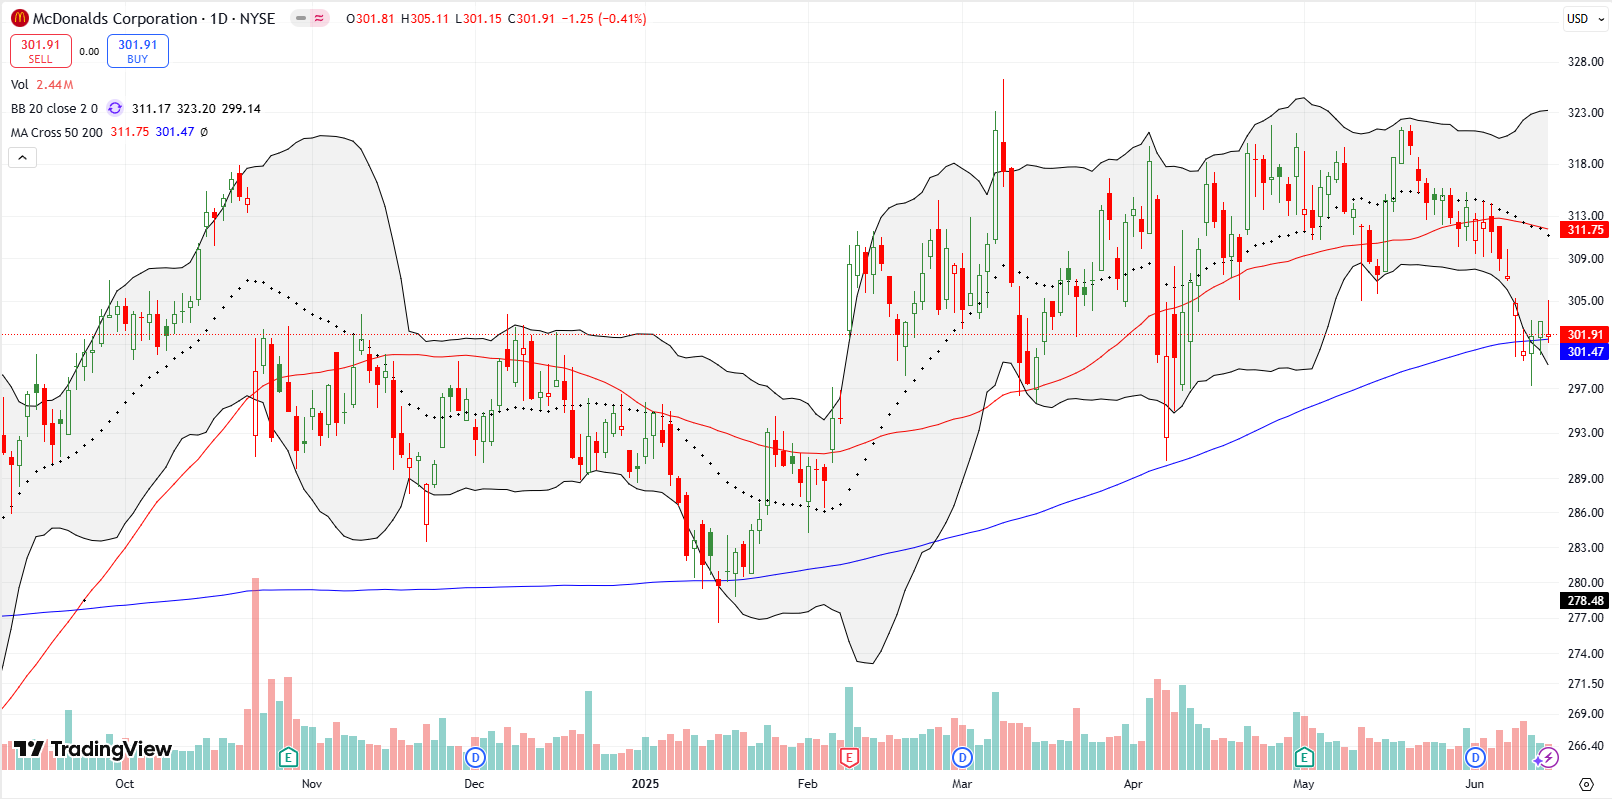
McDonalds Corporation (MCD)
MCD remains trapped in a trading range. The fast-food chain is clinging to 200DMA support but looks vulnerable. I am poised to short MCD on a confirmed breakdown. Note how well MCD held 200DMA support in April on an intraday basis.
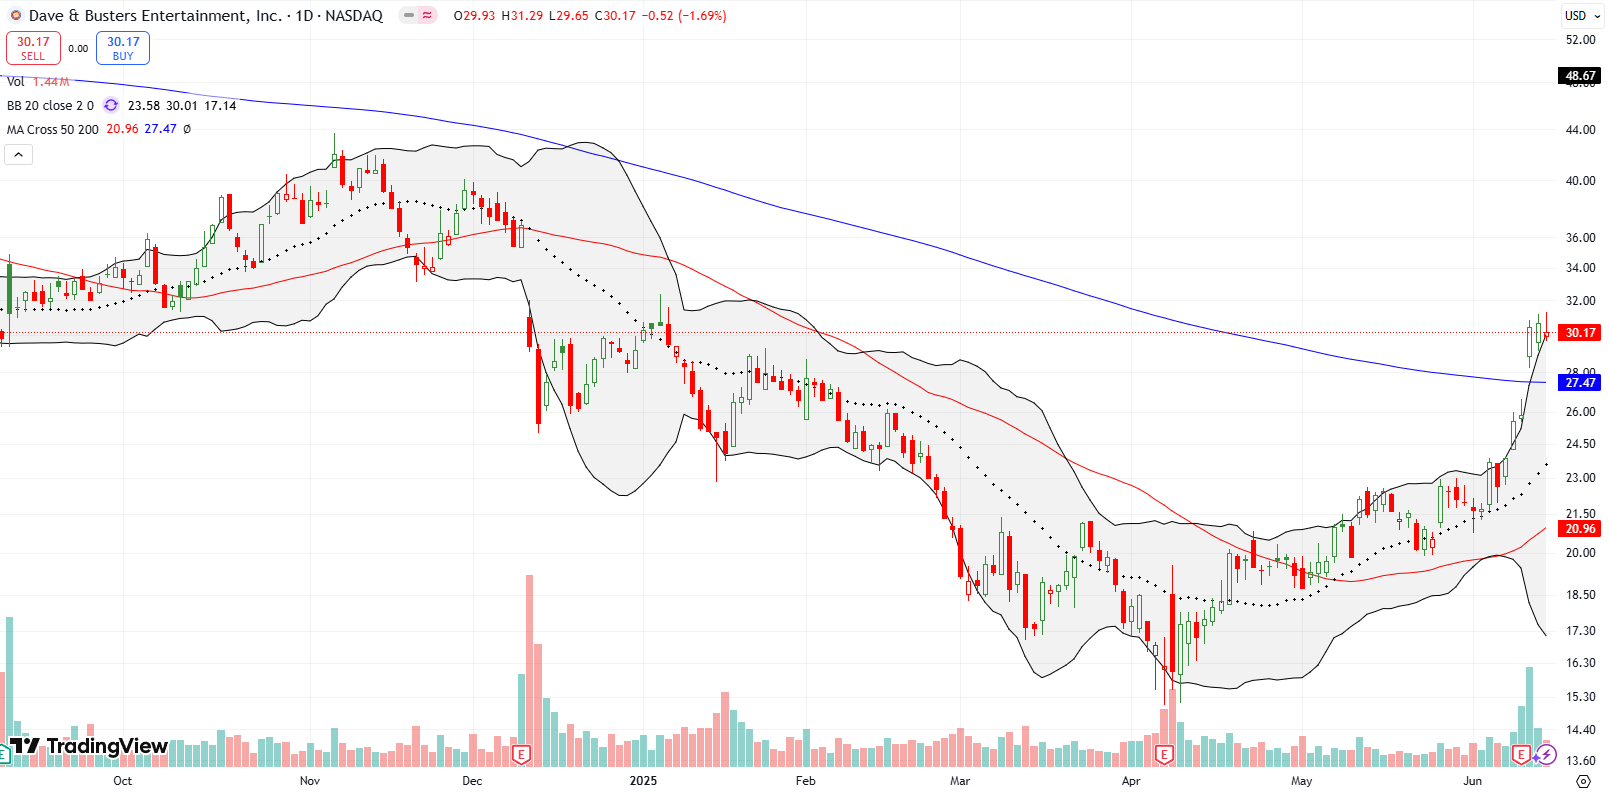
Dave & Buster’s Entertainment (PLAY)
PLAY surged 17.7% post-earnings with a 200DMA breakout. As part of risk management, I exited ahead of earnings and now await a pullback to re-enter. As a reminder, I have been trading PLAY as insiders keep buying shares and the market keeps selling PLAY despite the buying. The opportunities have been quite profitable, but, surprisingly enough, just holding after the insider buys has failed since I first identified insider buying as a trading signal.
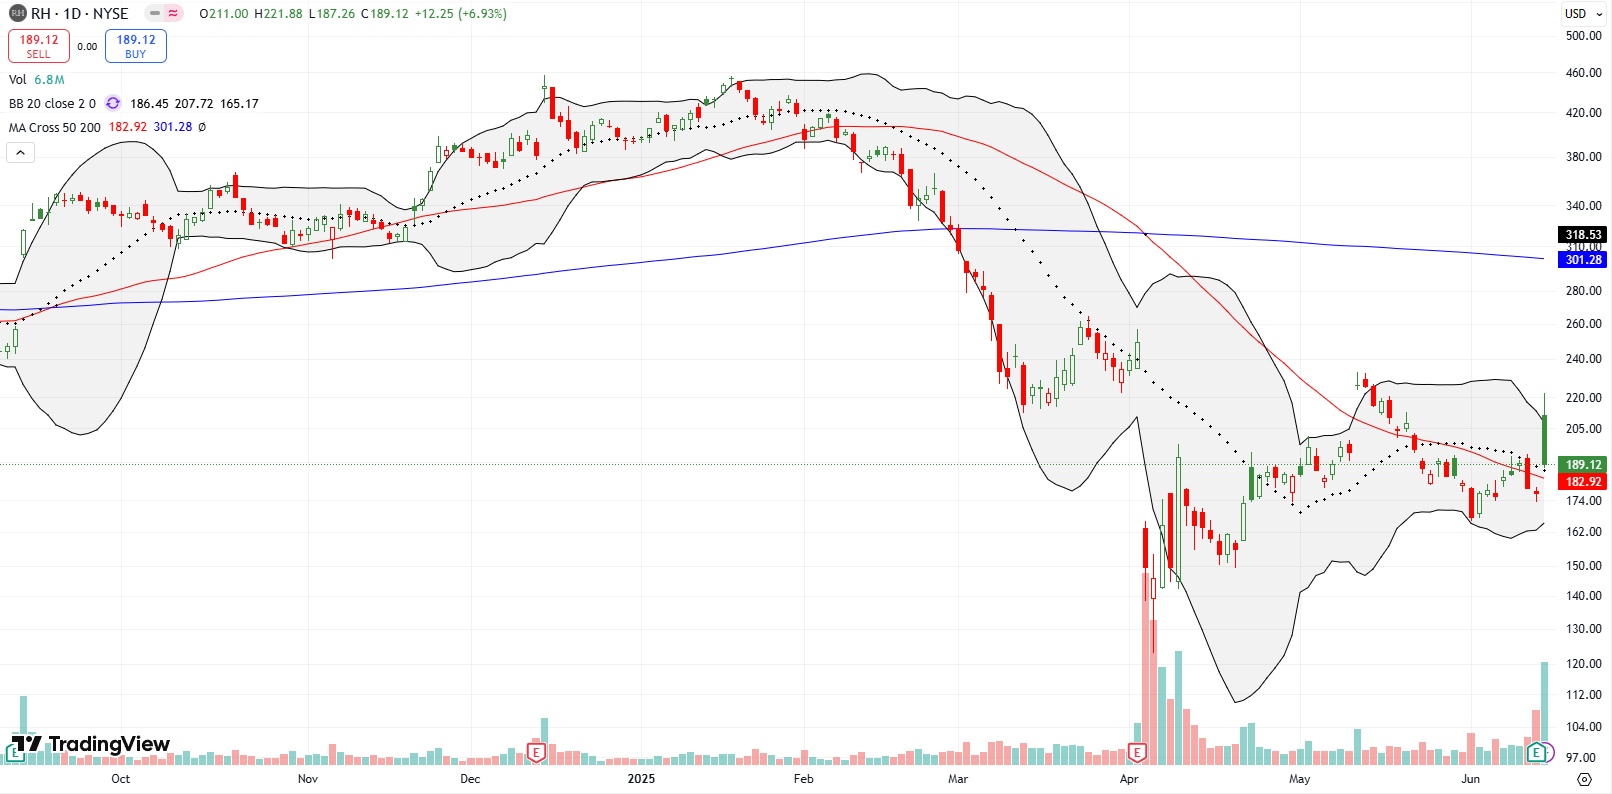
RH (RH)
Home furnishings company RH experienced a “gap and crap” post-earnings, closing up 6.9% after being up as much as 19%. These wild price wings have the markings of a short squeeze. RH has 17.3% short interest. The short interest makes sense to me given RH sells very expensive products during a bear market in housing. However, only a close below the June low, which would confirm fresh weakness, would get me interested in daring to join the bears (with put options of course).
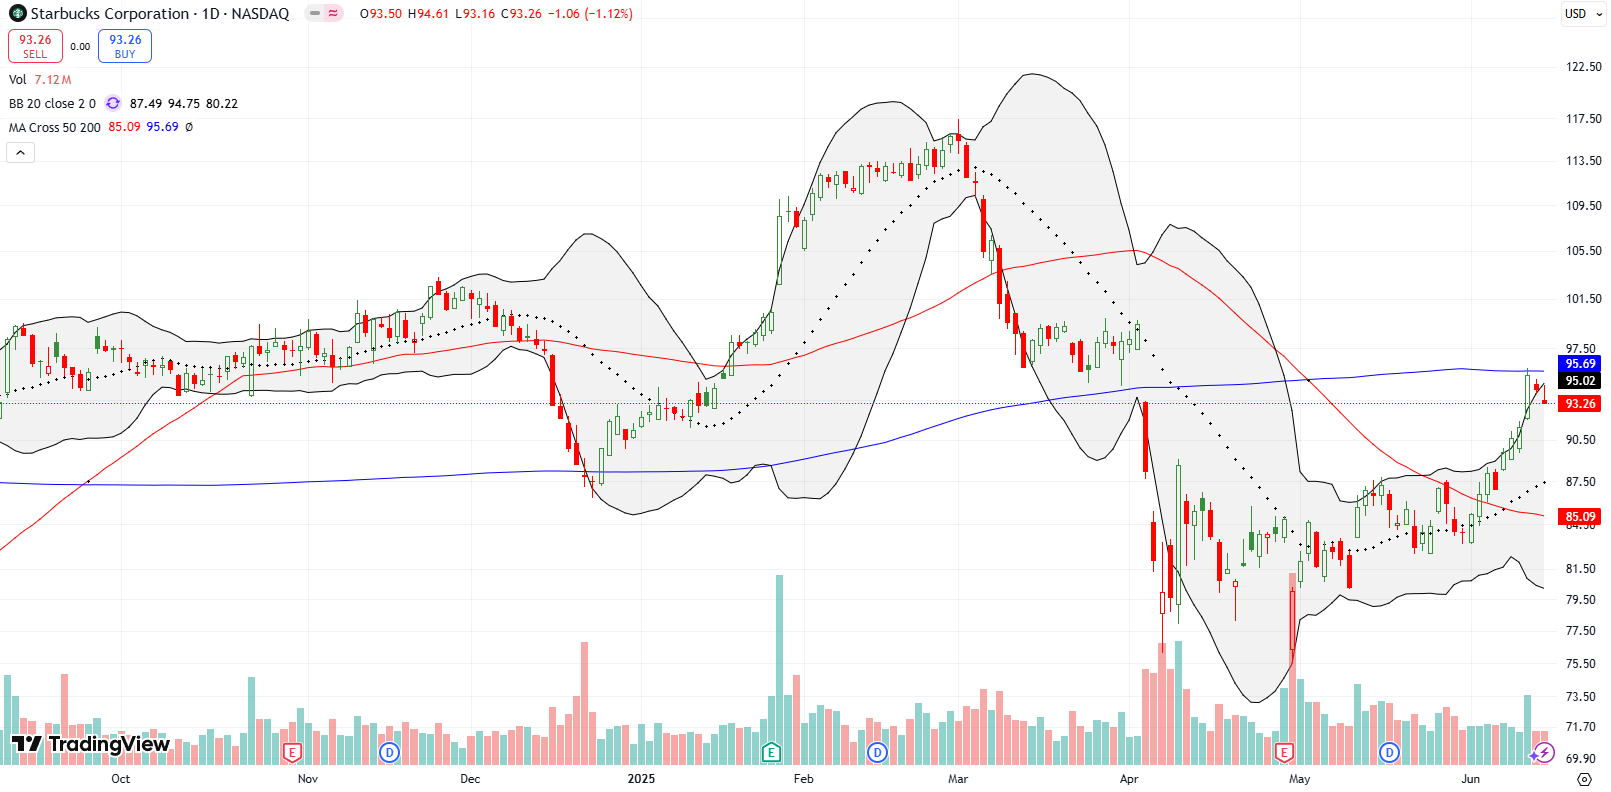
Starbucks (SBUX)
Coffee house SBUX surged 4.3% on positive news about its business in China news. Yet, the stock still failed at 200DMA resistance. I am waiting for a 20DMA test before entering (sound familiar?).
Adobe (ADBE)
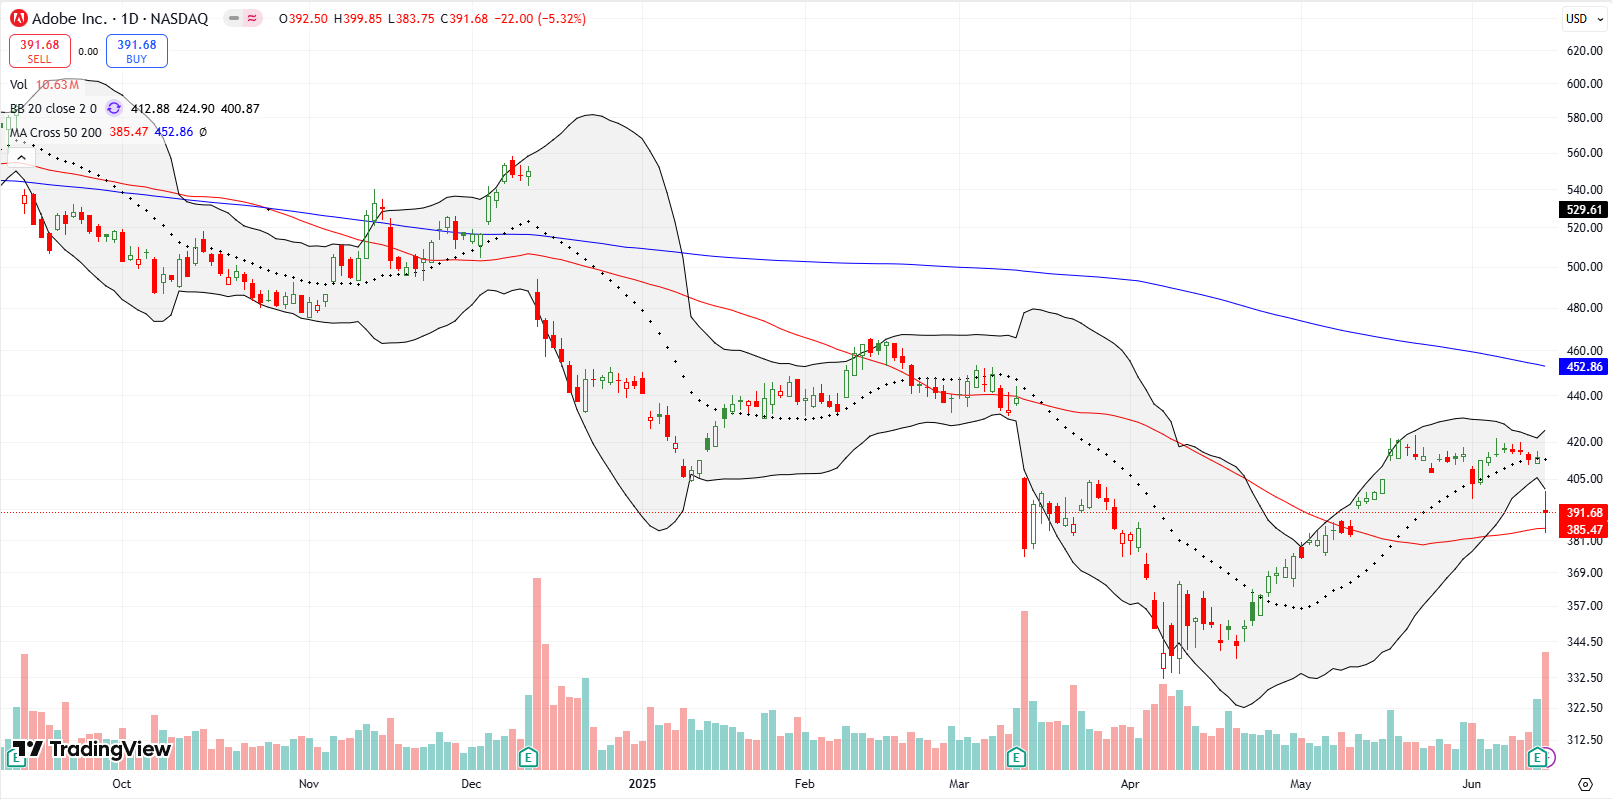
ADBE dropped 5.3% on earnings but held 50DMA support. The stock is also over-stretched below its lower BB. Despite the support, the long-term trend is weak with ADBE topping out all the way back in 2021. I am staying away.
Be careful out there!
Footnotes
Subscribe for free to get email notifications of future posts!
“Above the 50” (AT50) uses the percentage of stocks trading above their respective 50-day moving averages (DMAs) to measure breadth in the stock market. Breadth defines the distribution of participation in a rally or sell-off. As a result, AT50 identifies extremes in market sentiment that are likely to reverse. Above the 50 is my alternative name for “MMFI” which is a symbol TradingView.com and other chart vendors use for this breadth indicator. Learn more about AT50 on my Market Breadth Resource Page. AT200, or MMTH, measures the percentage of stocks trading above their respective 200DMAs.
Active AT50 (MMFI) periods: Day #34 over 20%, Day #32 over 30%, Day #27 over 40%, Day #22 over 50%, Day #20 over 60%, Day #1 under 70% (underperiod ending 5 days overbought)
Source for charts unless otherwise noted: TradingView.com
Full disclosure: long IWM shares, long ETSY calendar call spread, long USO puts, long FLR
FOLLOW Dr. Duru’s commentary on financial markets via StockTwits, BlueSky, and even Instagram!
*Charting notes: Stock prices are not adjusted for dividends. Candlestick charts use hollow bodies: open candles indicate a close higher than the open, filled candles indicate an open higher than the close.
* Blog notes: this blog was written based on the heavily edited transcript of the following video that includes a live review of the stock charts featured in this post. I used ChatGPT to process the transcript.

