

Stock Market Commentary
Last week marked an important shift as the stock market experienced overdue relief. Most notably, there were no major headlines causing significant disruptions in financial markets. Instead, the market continued the theme of recovery from the previous week, driven by policymakers pivoting their messaging about the economic chaos triggered by policies and tariffs.
The result was a calmer week with a strong upward bias, presenting excellent follow-through from the prior oversold period. Overall, the market experienced a strong three days in the post-oversold period, facing some resistance at previous peaks. If the market can push above these peaks, it could confirm the end of the downtrend of lower highs and lower lows, suggesting that this recent low may be more sustainable than I expected. Looking back, such a development would confirm that the green shoots I described on April 7th delivered a truly golden signal. Still, I remain cautious given the length of the last oversold period.
The Stock Market Indices
S&P 500 (SPY)
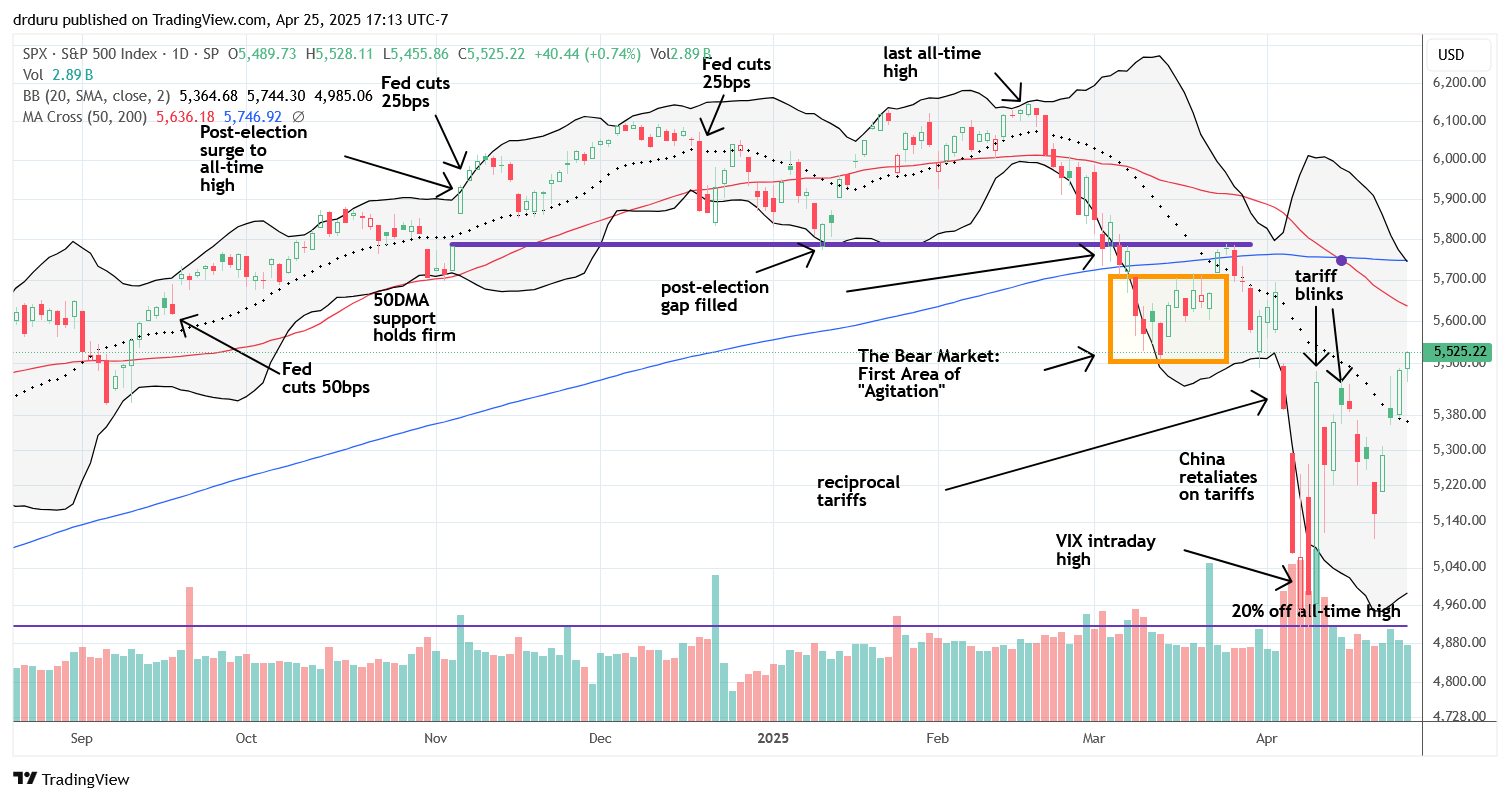
The S&P 500 made an important achievement by closing above its high from the April 9th tariff blink. Although the announced pause in reciprocal tariffs lasts only 90 days, the index looks strong for now. If current momentum holds, SPY will likely end April flat, just in time to hit 50-day moving average (DMA) resistance. At that point the next big question will be whether buyers have sufficient purchasing power left to push upward to resistance at the 200DMA (the blue line below).
NASDAQ (COMPQ)
The NASDAQ also climbed above its April 9th high and now faces its downtrending 50DMA resistance. The tech laden index sits right around the multiple closing lows from March. Amazingly, despite all the volatility caused by tariff drama and trauma, the NASDAQ is now slightly positive for the month, an outcome that seemed unlikely given recent market conditions. Imagine, very soon both the S&P 500 and the NASDAQ could position themselves as if nothing ever happened with the tariff drama and trauma. In other words, the market is already starting to forget the past and looking forward with its typical optimism about future outcomes.
")
The iShares Russell 2000 ETF (IWM)
IWM created a notable week by closing at the conventional bear market line for two days in a row and by testing that resistance for three straight days. I am now on alert to care about IWM again. On a breakout that ends the recent conventional bear market, IWM should rush toward its 50DMA resistance. I hope to catch such a move with IWM call options. I continue to hold IWM shares as a longer-term investment.
")
The Short-Term Trading Call With Relief
- AT50 (MMFI) = 32.1% of stocks are trading above their respective 50-day moving averages
- AT200 (MMTH) = 29.4% of stocks are trading above their respective 200-day moving averages
- Short-term Trading Call: bullish
Market breadth expanded impressively this week as the stock market heaved a huge sigh of relief. AT50 (MMFI), the percentage of stocks trading above their respective 50DMAs, jumped sharply after the end of the oversold period. While some resistance remains at the last peak in late March, the upward bias indicates strength. If the stock market pushes above that resistance, it could signal a break from the persistent pattern of lower highs and lower lows for market breadth, a bullish development.
AT200 (MMTH), the percentage of stocks trading above their 200DMAs, stalled slightly after AT50 broke out of oversold territory. This longer-term indicator of the health of market breadth filled a prior gap that broke open in the early stages of tariff chaos. AT200 remains stuck in a downtrend and needs sustained buying power to fully heal.
The volatility index (VIX) made a decisive move downward, closing at 25.0 for the week. The VIX confirms the market’s growing relief from past tariff drama, like assuming positive outcomes during and after the 90-day tariff pause. The VIX is now at its own 50DMA, so volatility could deliver a “last gasp” bounce this week before resuming its descent. Treasury Secretary Bessent’s April 14th prediction that the VIX had peaked continues to hold true so far…
")
The Equities: Relief
American Express (AXP)
American Express (AXP) confirmed a 20DMA (the dotted line) breakout but fell short of testing 50DMA resistance. A still uptrending 200DMA awaits as a tantalizing target for a final confirmation of fresh bullishness for the credit card company.
")
Accenture (ACN)
Accenture (ACN) set up a good buying pattern at the end of March. The bottom held for just two more days before tariff drama took ACN down with the rest of the market. ACN closed the week with three straight days struggling at 20DMA resistance, and the stock remains below its April 9th close. Thus, I am not yet breathing a sigh of relief on my holdings in ACN.
")
Intuitive Surgical (ISRG)
I lamented ISRG’s failure to hold 200DMA support in early March. I bought the stock just above that critical support before I fully appreciated the expanding bearish momentum in the stock market. Last week, ISRG survived earnings with a small but important 1.9% gain. The stock closed the week marginally above its 200DMA and a near test of downtrending 50DMA resistance. ISRG is not yet above its April 9th closing high (a day when ISRG surged 14.3%!), so I remain wary.
")
Alphabet (GOOG)
Alphabet Inc (GOOG), despite ongoing antitrust challenges, is trading above its April 9th high and broke out above its 20DMA downtrend on its way to a 1.5% post-earnings gain. Unfortunately, the stock faded from 50DMA resistance and tainted the relief from a week of persistent buying pressure.
")
Twilio (TWLO)
Twilio (TWLO) broke above its converged 20DMA and 200DMA last week, showing resilience during tariff drama. The stock never strayed too far away from its 200DMA and now looks ready to test overhead 50DMA resistance. I bought shares on the 200DMA breakout as I am eager to participate in what could be an impressive recovery at some point.
")
Vertiv Holdings (VRT)
My favorite single stock AI investment is Vertiv Holdings (VRT). VRT posted an impressive post-earnings gap up of 8.5%, followed by a 50DMA breakout, setting the stage for a potential run to 200DMA resistance. I added to my shares during the tariff drama and sold a $75 call option against that second tranche. Those shares are now called away. I also sold a June $95 call option against my original position (which itself was the result of selling a $95 put option just ahead of the tariff drama). I am expecting VRT to stall out at 200DMA resistance. If not, I will reposition more aggressively bullish.
")
Goldman Sachs (GS)
Goldman Sachs (GS) was one of my oversold period trades where I took profits on April 9th. I am now watching as the stock battles with 200DMA resistance. A breakout above the 200DMA and 50DMA would signal renewed bullishness.
")
Robert Half Inc (RHI)
Staffing company Robert Half (RHI) dropped 3.1% post-earnings, reaching levels not seen since May 2020. The company’s declining revenue trends rings out an alarm for the labor market.
")
Impinj (PI)
Impinj (PI) has suffered a persistent downtrend since it last peaked in October. The stock may finally be turning around after a 16.5% post-earnings gain closed the stock above its 50DMA resistance. Further buying would push PI above March’s consolidation and provide confirmed bullishness for the stock.
")
Starbucks (SBUX)
Starbucks (SBUX) looks tepid. The stock fell far short of challenging its downtrending 20DMA, signaling exhaustion after nearly filling a long-standing gap from last August’s hiring of Chipotle’s CEO. SBUX is one of the few stocks on my list on alert for a short if it makes a new low from here.
")
Microsoft (MSFT)
Microsoft (MSFT) made a bullish 50DMA breakout and is now in bullish territory just barely above its April 9th close. I am on hold with MSFT until after it reports earnings.
")
Amkor Technology (AMKR)
I talked up semiconductor stock Amkor Technology (AMKR) last August. The stock has disappointed since then. AMKR’s 20DMA has consistently capped the stock, and the 50DMA has reinforced a persistent and extended downtrend. I mistakenly kept holding onto this one to the point where it is almost too late to sell. Earnings should deliver a final verdict: a positive outcome will keep me in the stock. I am only willing to add to my position on a confirmed 50DMA breakout.
")
")
")
Be careful out there!
Footnotes
Subscribe for free to get email notifications of future posts!
“Above the 50” (AT50) uses the percentage of stocks trading above their respective 50-day moving averages (DMAs) to measure breadth in the stock market. Breadth defines the distribution of participation in a rally or sell-off. As a result, AT50 identifies extremes in market sentiment that are likely to reverse. Above the 50 is my alternative name for “MMFI” which is a symbol TradingView.com and other chart vendors use for this breadth indicator. Learn more about AT50 on my Market Breadth Resource Page. AT200, or MMTH, measures the percentage of stocks trading above their respective 200DMAs.
Active AT50 (MMFI) periods: Day #4 over 20%, Day #2 over 30%, Day #41 under 40%, Day #53 under 50%, Day #78 under 60%, Day #179 under 70%
Source for charts unless otherwise noted: TradingView.com
Full disclosure: long IWM call, long AMKR, long VRT and short a call option, long TWLO, long GOOG, long ISRG, long ACN, long AXP, long SPY put spread
FOLLOW Dr. Duru’s commentary on financial markets via StockTwits, BlueSky, and even Instagram!
*Charting notes: Stock prices are not adjusted for dividends. Candlestick charts use hollow bodies: open candles indicate a close higher than the open, filled candles indicate an open higher than the close.
* Blog notes: this blog was written based on the heavily edited transcript of the following video that includes a live review of the stock charts featured in this post. I used ChatGPT to process the transcript.