Stock Market Commentary
Writing about financial markets always feels surreal when tragedy and disaster dominate the news headlines. My cognitive dissonance gets particularly poignant when the stock market does not reflect the scale and scope of events. As massive fires rage in Los Angeles causing to-date $135B to $150B in economic losses and loss of life, writing about the fizzling of post-election euphoria in the stock market and imminent oversold conditions feels like commenting on a gnat’s struggle to fly in a windstorm. The presiding reason for the market’s weakness further emphasizes the surreal nature of the situation: an economy that remains strong enough to continue whittling down expectations for rate cuts from the Federal Reserve.
The latest “good news is bad news” scenario came from yet another strong jobs report that defied “expectations” (who ARE these people making these projections anyway?) with 250,000 new jobs created and unemployment falling from 4.2% to 4.1%. Long-term bond yields have trended higher ever since the Fed first cut rates, and THAT disconnect is increasingly stark. Until the Fed’s “hawkish rate cut” last month, the stock market cheerily rallied despite rising rates.
Permabull Tom Lee provided a great explanation for the market’s general willingness to ignore the bond market: the bond market is wrong. Lee called the rise in yields a “false flag” (emphasis mine): “I don’t think that this is going to be the level we see a few months from now, and I think that’s more important because ultimately if yields begin to fall, because inflation pressures are easing or if the job market is a bit softer than expected, it really puts the Fed put back in focus.” At least this expectation is better than Wall Street hoping for a recession to force the Fed’s hand.
The Stock Market Indices
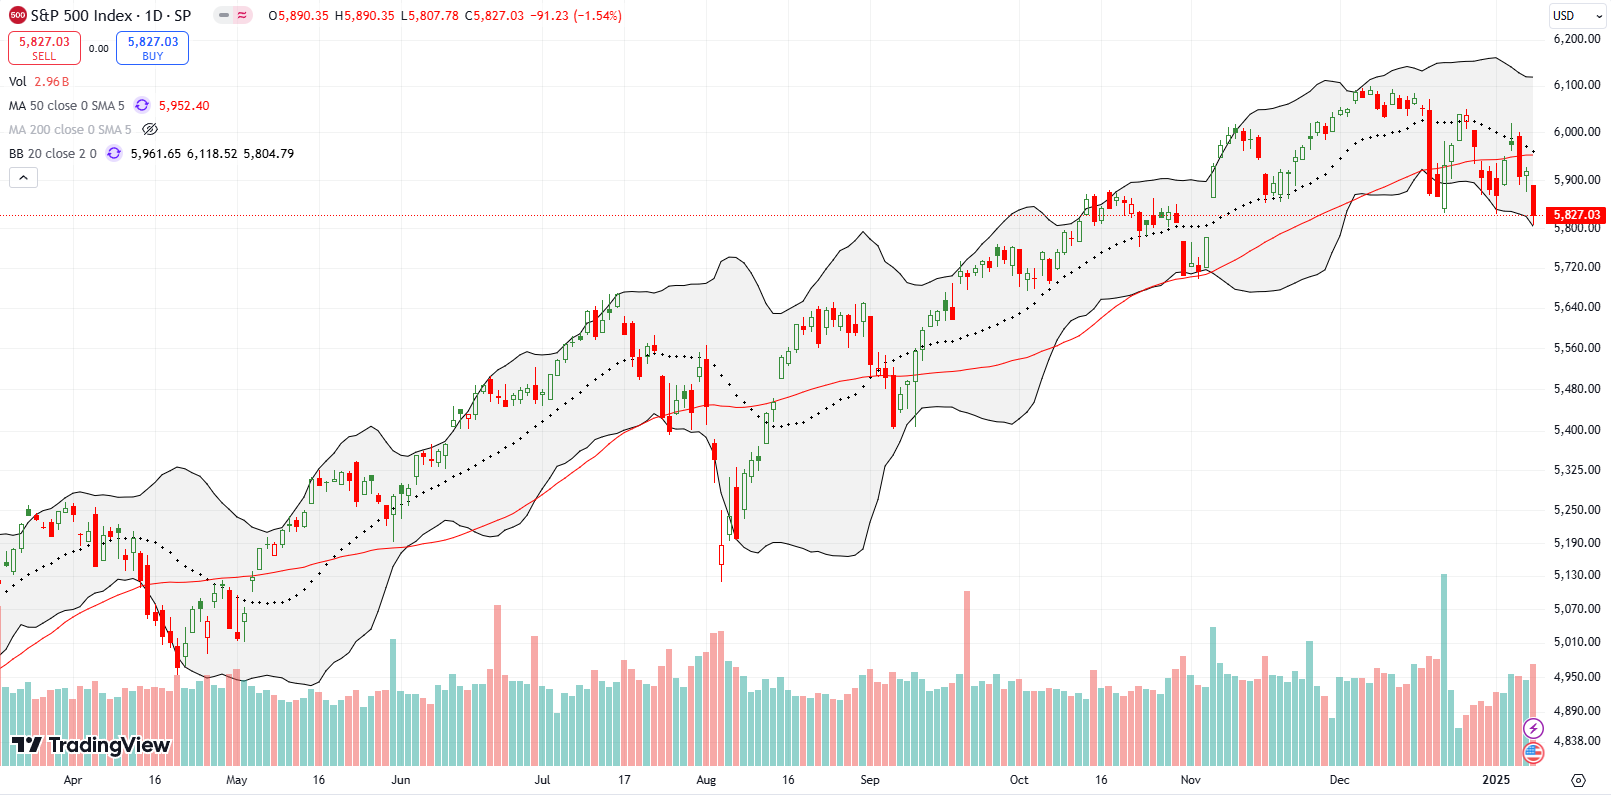
The S&P 500 (SPY) confirmed a breakdown below its 50-day moving average (DMA) (the red line below) support. From a relative technical standpoint, the current pullback is the index’s worst since the run-up from the October, 2023 low began. First of all, this is only the third confirmed 50DMA breakdown since the October, 2023 lows. In the prior two episodes, the S&P 500 was able to quickly reverse the loss that created the first breakdown. In THIS case, the index stopped just short of a full reversal of the big December 18, 2024 drawdown and even proceeded to break 50DMA support two more times. As if all those technical stumbles were not bad enough, in the middle of these failures, the S&P 500 has failed twice at resistance from its declining 20DMA (the dashed line).
The technical picture looks like one of buyer exhaustion (long overdue) that sets up a complete reversal of all the gains from the post-election euphoria. The S&P 500 is now up just 0.8% since the close on election day (Tuesday, November 5, 2024). Given the rapid decline in market breadth (see below), a complete reversal will converge with the first oversold trading conditions since the October, 2023 lows.
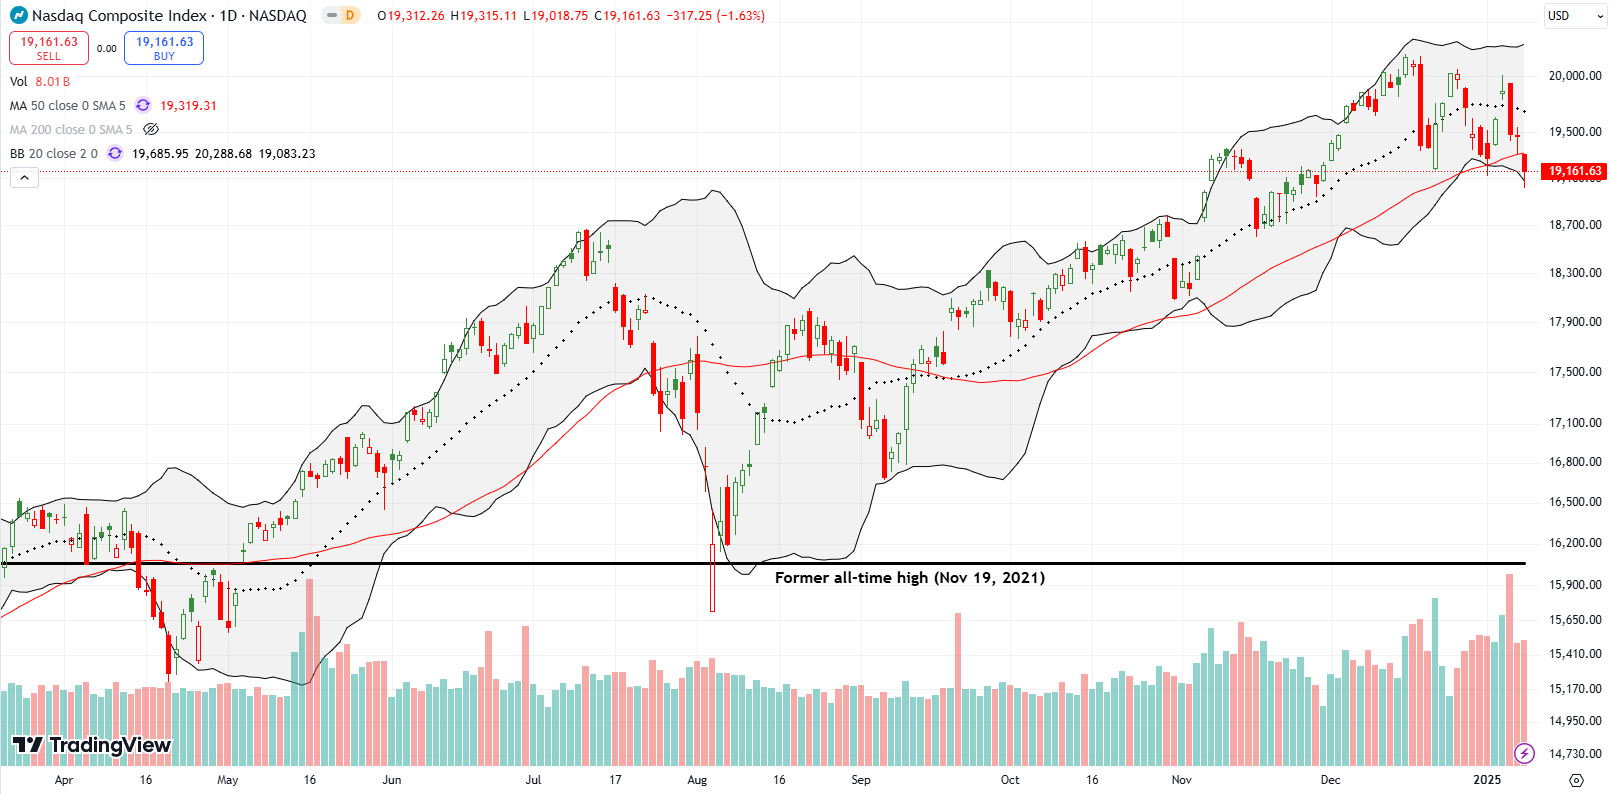
The NASDAQ (COMPQX) closed below its uptrending 50DMA for the first time since September. The 6-week low effectively created a breakdown below a wide trading range. While the tech-laden index does not look as toppy as the S&P 500, the momentum is definitely fizzling. A confirmed 50DMA breakdown would put the NASDAQ in bearish territory and setup an eventual reversal of the post-election euphoria.
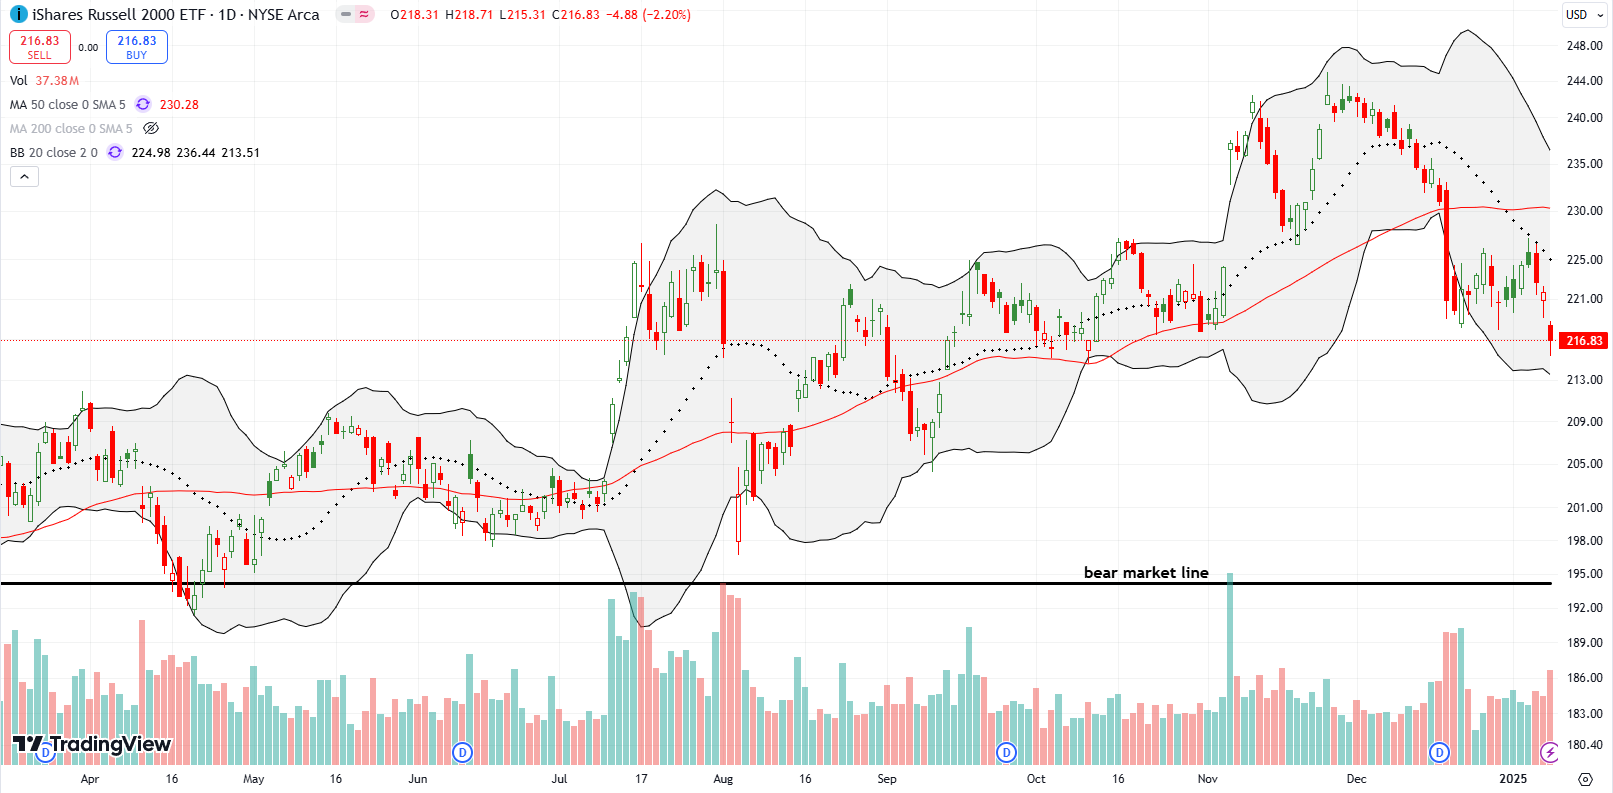
The iShares Russell 2000 ETF (IWM) struggled to hold its post-election euphoria almost from the beginning. The extreme pullback in mid-December finally finished the job of reversing the post-election gains. Last week’s steady losses and a confirmed failure at 20DMA resistance sealed the deal on the euphoria. Friday’s 2.2% loss took IWM to a test of the October low. Still, as usual, I bought an IWM call at the back-end of an extreme move. Now I look to flip the call on a bounce away from near oversold market levels.
The Short-Term Trading Call With Post-Election Euphoria Fizzling
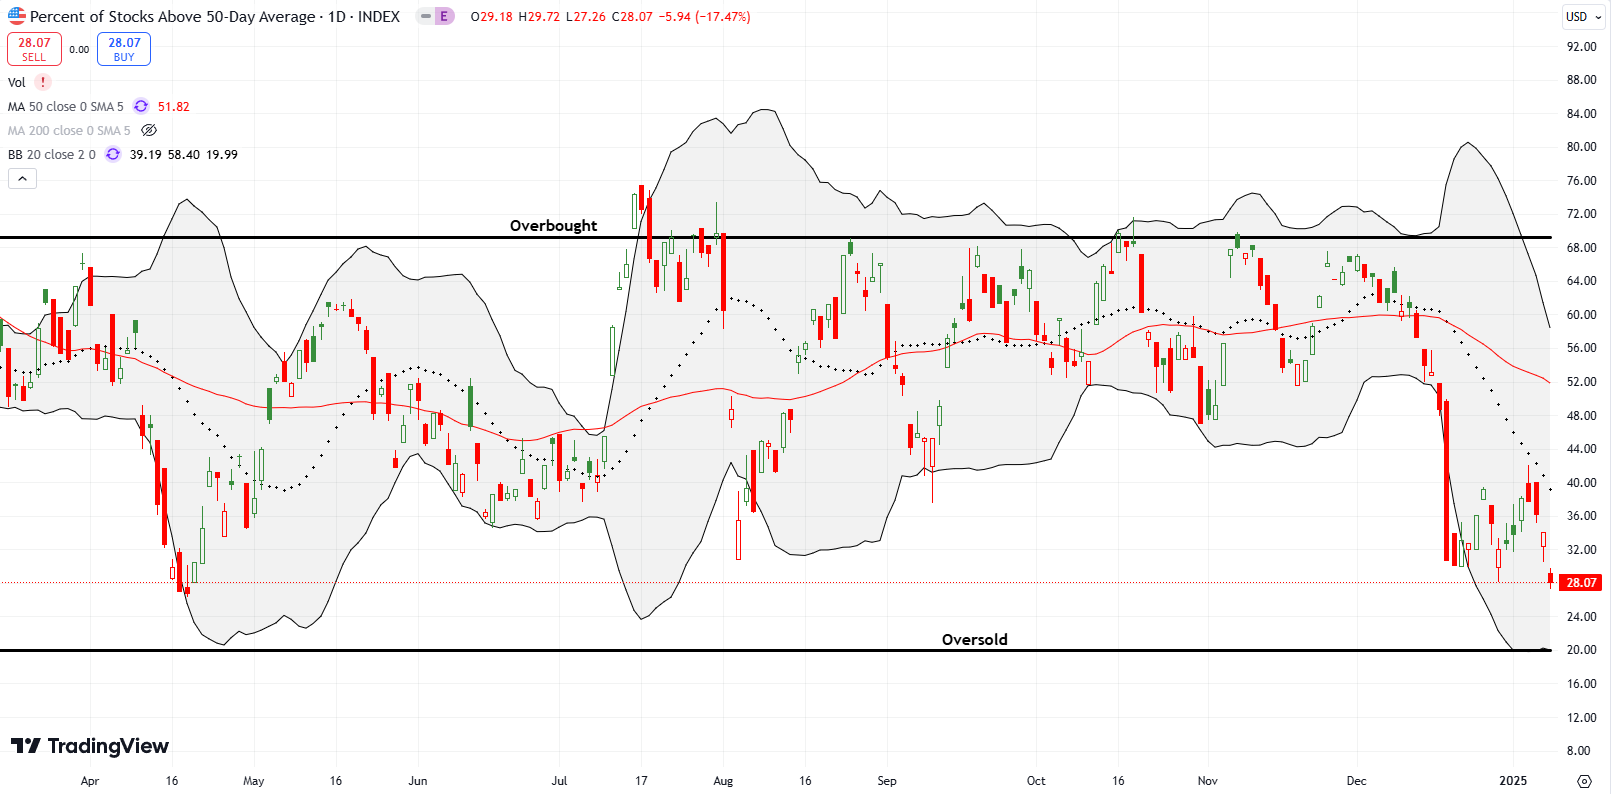
- AT50 (MMFI) = 28.1% of stocks are trading above their respective 50-day moving averages
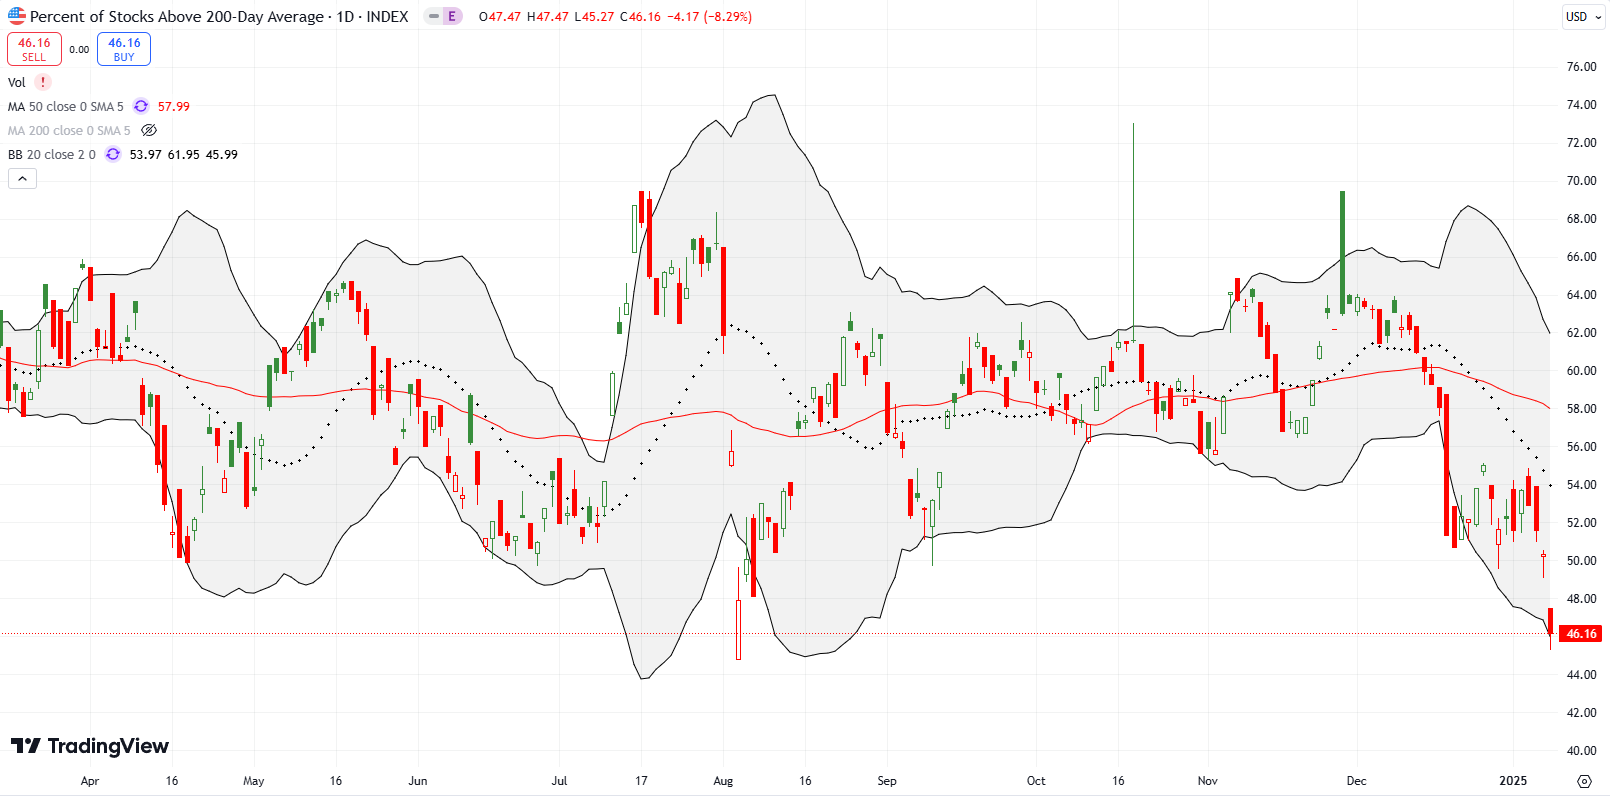
- AT200 (MMTH) = 46.2% of stocks are trading above their respective 200-day moving averages
- Short-term Trading Call: neutral
AT50 (MMFI), the percentage of stocks trading above their respective 50DMAs, closed the week at 28.1%, the first close under 30% since last April. My favorite technical indicator lost 10 percentage points for the week and now the oversold threshold is in sight. With post-election euphoria fizzling, conditions are in place for AT50 to drop into oversold conditions for the first time since the October, 2023 lows. Given the bearish momentum, I downgraded the short-term trading call to neutral. I am tempted to flip bearish with the S&P 500 topping out, but the extreme strength of the bull market requires measured trading calls to the downside. Whether AT50 goes oversold or not, indices and stocks like the S&P 500 will be great candidates for fades at resistance from the 50DMA.
In the meantime, I recommend reading a great article sent to me by a friend called “THERE ARE IDIOTS: Seven pillars of market bubbles” by Owen A. Lamont, Ph.D. This application of behavioral finance critiques the relentless pursuit of hype and promotion in financial markets. Lamont also delivers a sobering reminder of the need for risk management and never taking for granted that future returns are guaranteed.
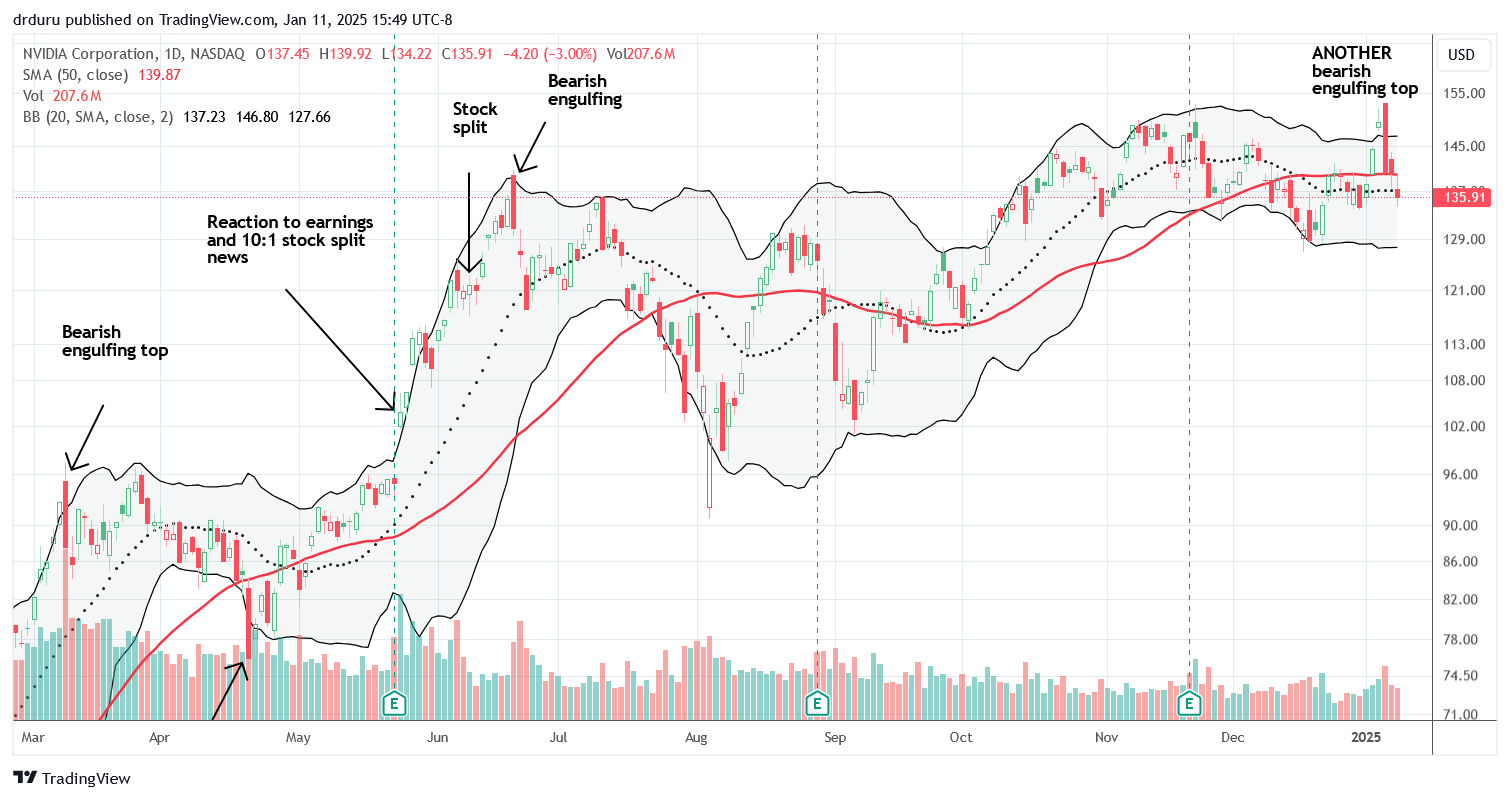
NVIDIA Corporation (NVDA) flipped from providing a beacon for continuing the post-election euphoria to flagging confirmation of a fizzling out in momentum. Buzz and excitement over product news at the Consumer Electronic Show (CES) sent NVDA surging to a new all-time high. The very next day, “sell the news” trading action created a bearish engulfing top so convincing that NVDA plunged right to 50DMA support. Sellers pressed the issue with Friday’s 50DMA breakdown.
NVDA is a pro at bearish engulfing tops. The last two tops brought NVDA’s momentum to a screeching halt. The last top held for 4 months. Something tells me this latest top will hold even longer. Friday’s close took NVDA right to the all-time high that preceded the last bearish engulfing top.
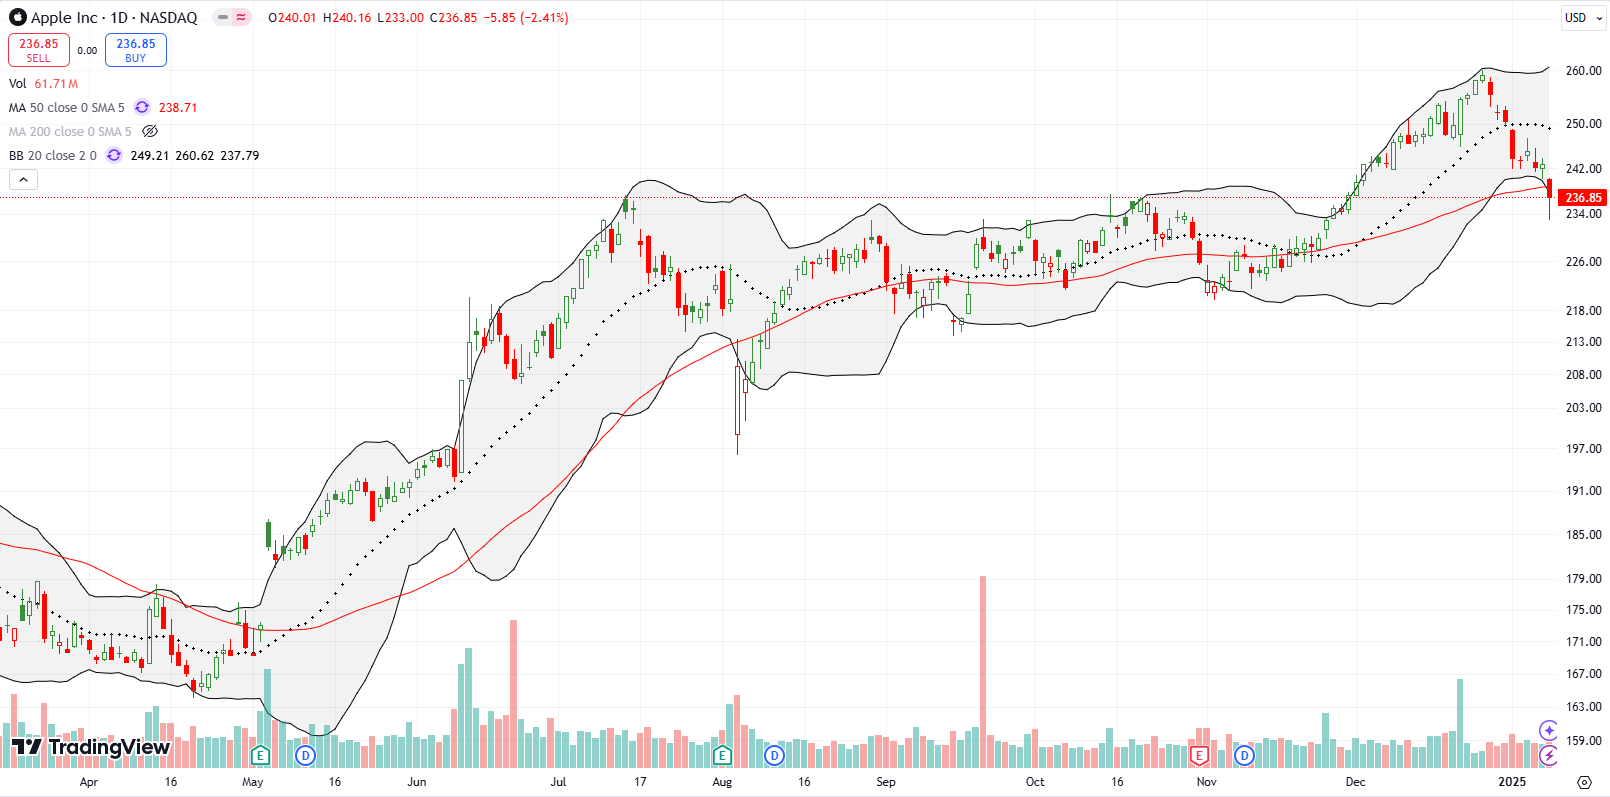
The post-election euphoria was delayed for Apple Inc (AAPL) given the election happened just days after an earnings disappointment. Once AAPL got going and broke out to a new all-time high, the stock rallied through most of December. AAPL has sold off nearly straight down since that last all-time high. The stock closed last week below its 50DMA to fizzle out its own version of post-election euphoria. With AAPL right on top of the previous breakout point, buyers have a chance to rebound the stock and re-establish the tone. Otherwise, I will look for a drop toward the bottom of the last trading range around $218 or so.
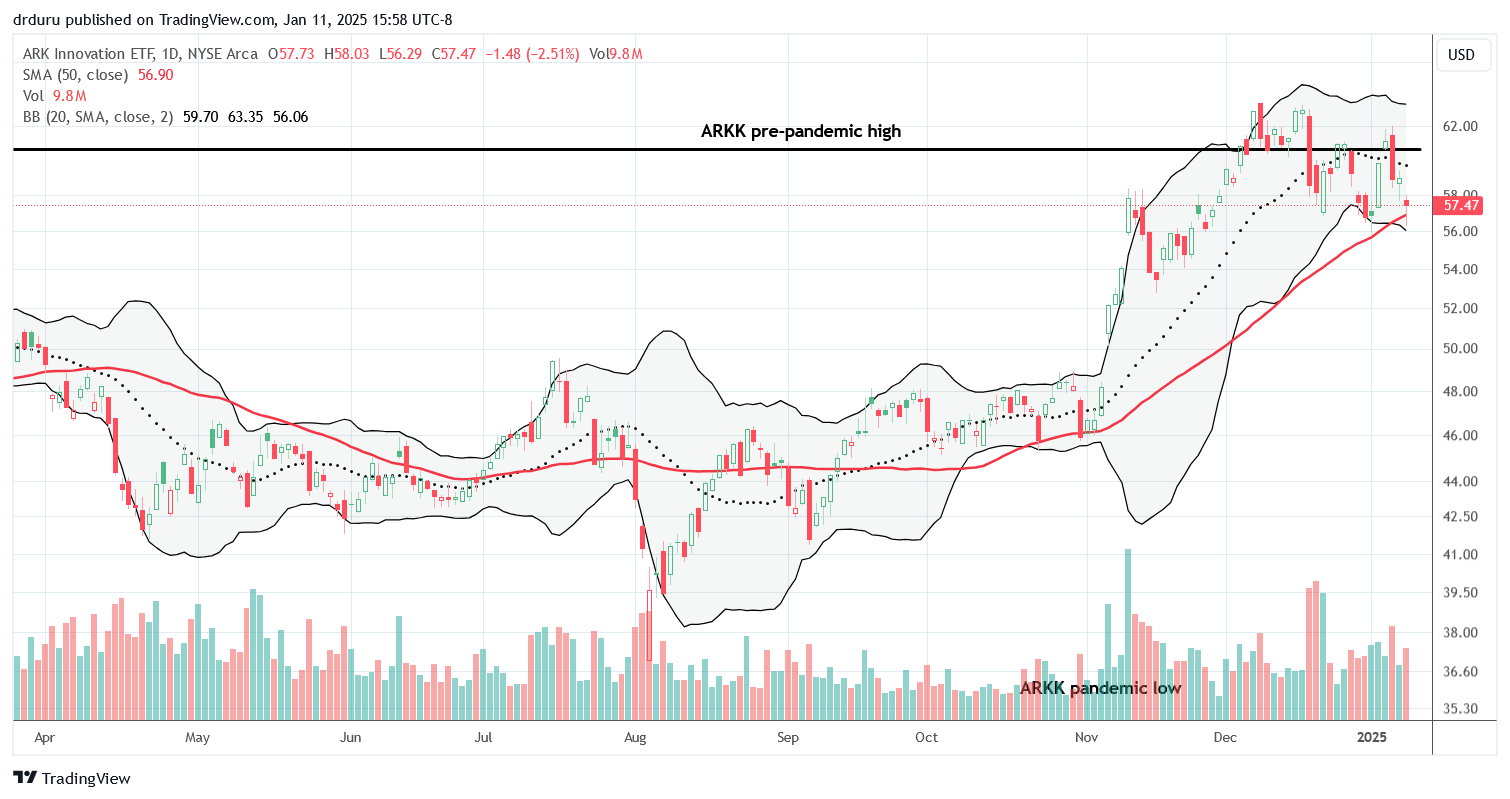
ARK Innovation ETF (ARKK) continues to struggle at its pre-pandemic high as expected. ARK closed the week with its second test of 50DMA support of the new year. The recent churn has allowed me to sell call options over and over against my trading position. If ARKK continues downward I will next look for the ETF to hold support at the mid-November low which was part of the first post-election pullback.
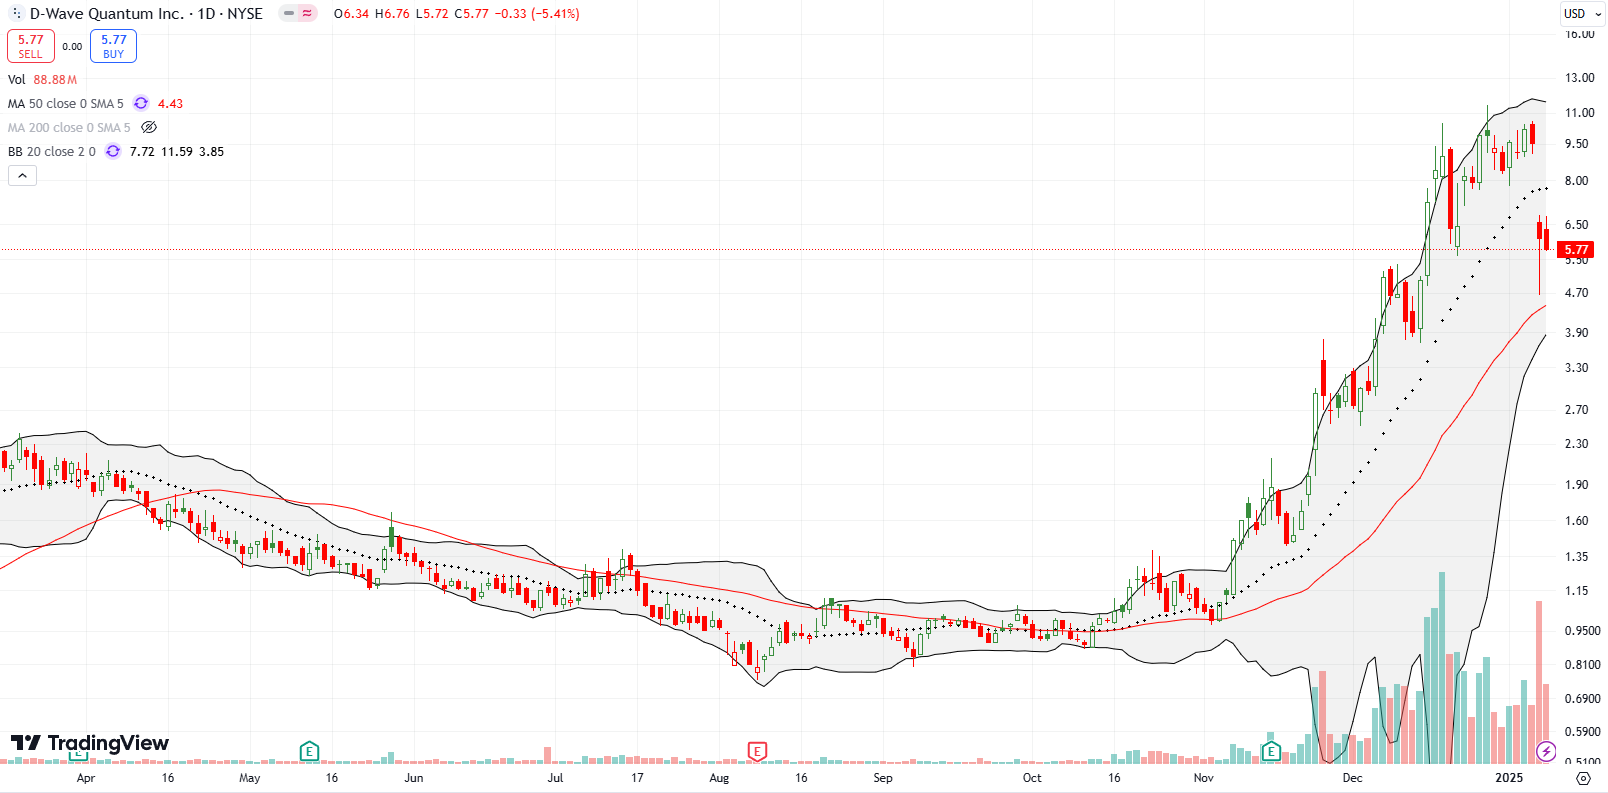
This week’s quantum computing stock is D-Wave Quantum Inc (QBTS). The CEO of QBTS, Alan Baratz, took issue with NVDA’s CEO Jensen Huang broadcasting an estimate that quantum computing is 10 to 30 years away from commercial relevance. That news sent quantum computing stocks crashing. QBTS fell 36.1% but still remained 475% higher since the end of October. Baratz insisted that QBTS is delivering for its customers today, and he looked forward to talking about earnings. Right on schedule, QBTS released earnings guidance to tell the market the bullish side QBTS’s quantum story. The quote below reads like an answer to all skeptics and people who do not understand quantum’s different technologies and current applications:
“With remarkable growth in bookings, our first Advantage system sale and an increasing number of customer applications moving into production, in our view, D-Wave is clearly driving the commercialization of quantum computing. While others remain in the research and development mode, we are delivering incredibly powerful technology and products to customers today, helping them tackle their tough computational problems faster, better and with less energy.”
QBTS still fell 5.4% after this news and looks set to retest 50DMA support. I doubt support will survive the next test.
For additional bullish quantum commentary, see this BNN Bloomberg interview with equity research analyst David Williams:
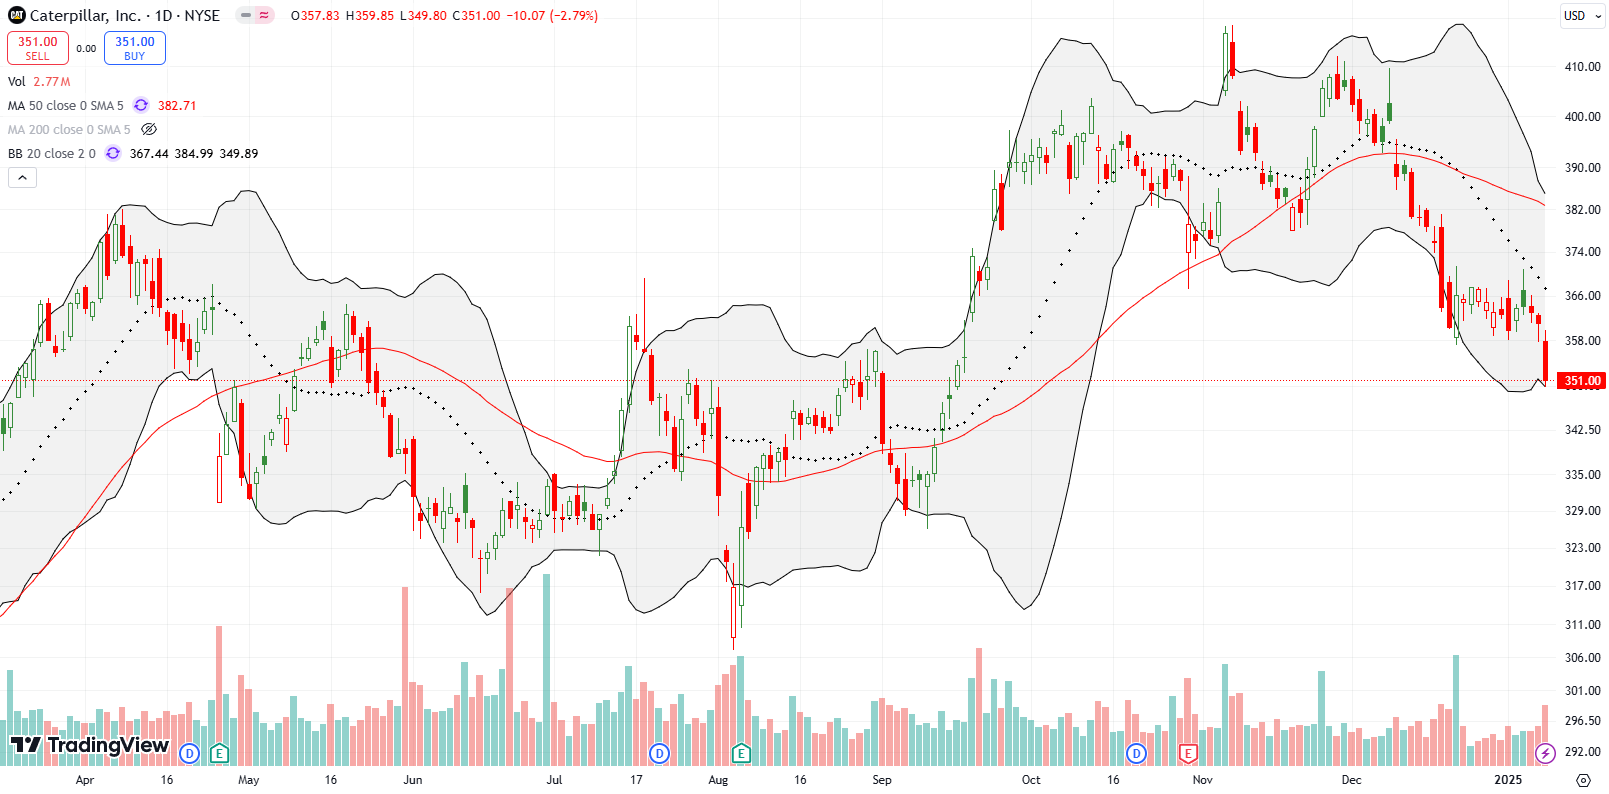
Caterpillar, Inc (CAT), my favorite hedge against bullishness, delivered last week. I added a put to an existing put spread as CAT tested downward 20DMA resistance. I took profits after CAT quickly returned to the bottom of its 3-week trading range. The next day CAT fell another 2.8%. I decided to hold the put spread for at least one more day given the fizzling momentum that is pushing the market into oversold conditions.
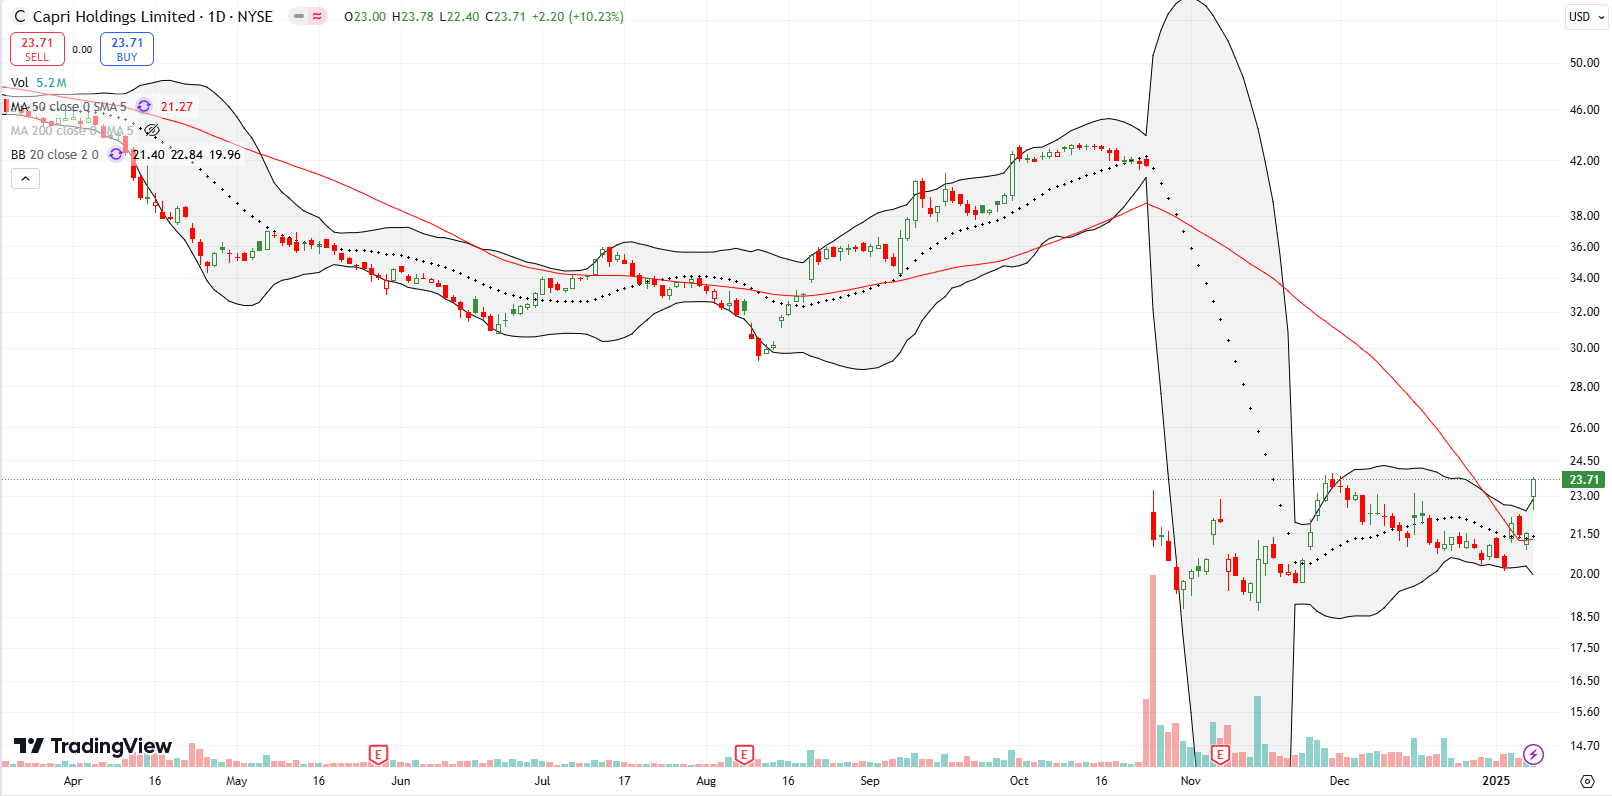
Capri Holdings Ltd (CPRI) made a fresh bid to become a turn-around stock. CPRI plunged 48.9% after the Federal Trade Commission (FTC) blocked Tapestry’s (TPR) proposed acquisition of the company. Always ready to consider trading against extreme moves in the stock market, I picked up shares in CPRI in the hopes that at some point the market will start to believe in the valuation TPR was willing to pay. That time may have started with several analysts upgrading CPRI last week. Friday’s rating announcements was good enough for a 10.2% jump. I happened to sell a January $24 call against my position ahead of the move, so now I face the potential of getting called away.
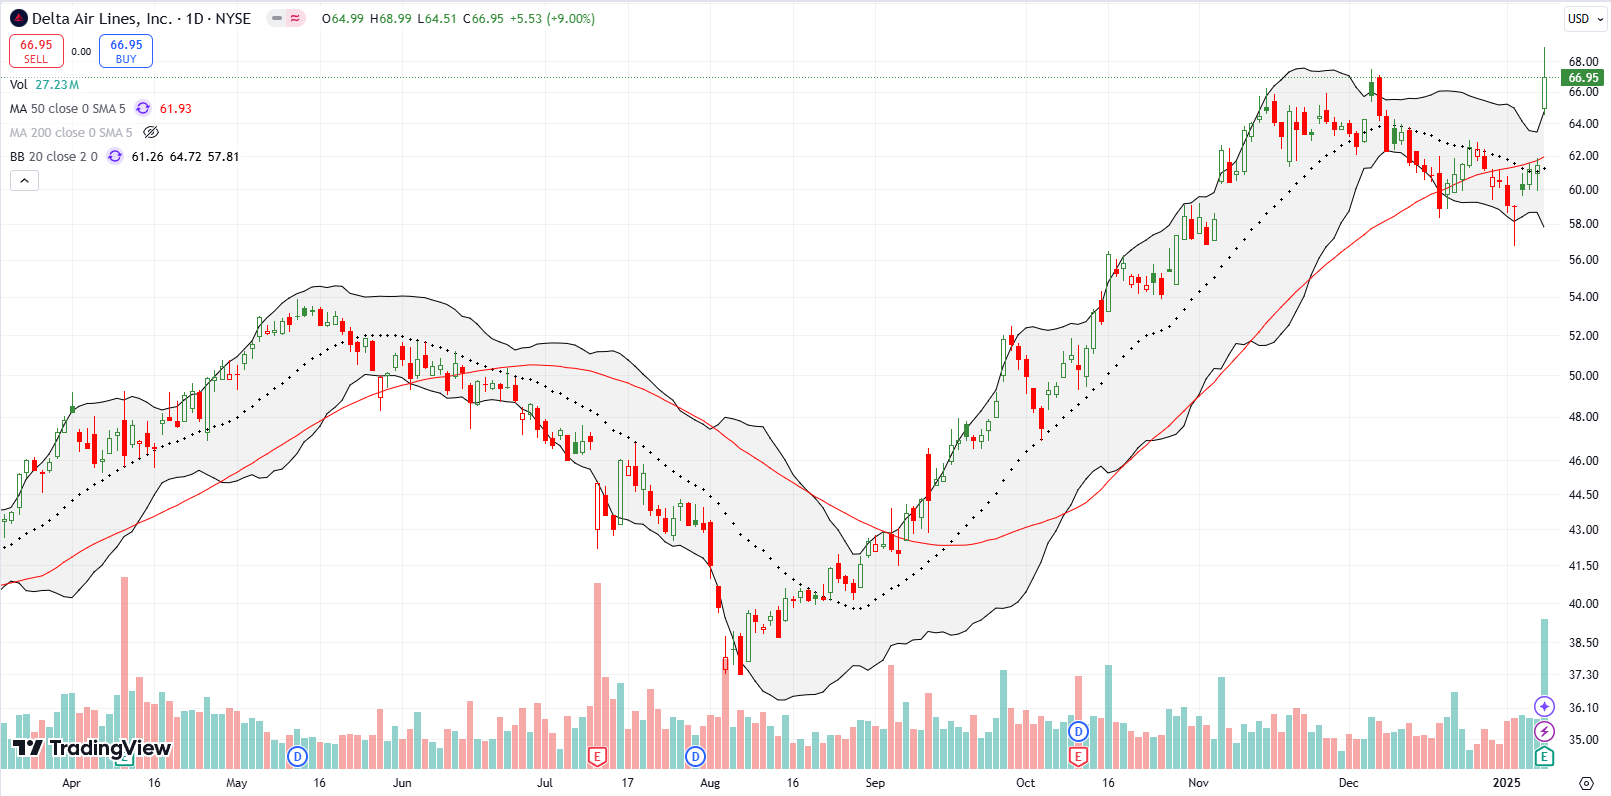
I had to blink twice when I saw Delta Air Lines, Inc (DAL) soaring to an all-time high. A post-earnings gain of 9.0% reclaimed the 50DMA as support. Meanwhile, my bet on airlines, Southwest (LUV), remains a major laggard thanks to a slow recovery from the winter 2022 scheduling debacle. Apparently, Delta is winning with business customers, a segment that Southwest does not serve much given its focus on consumer leisure travel.
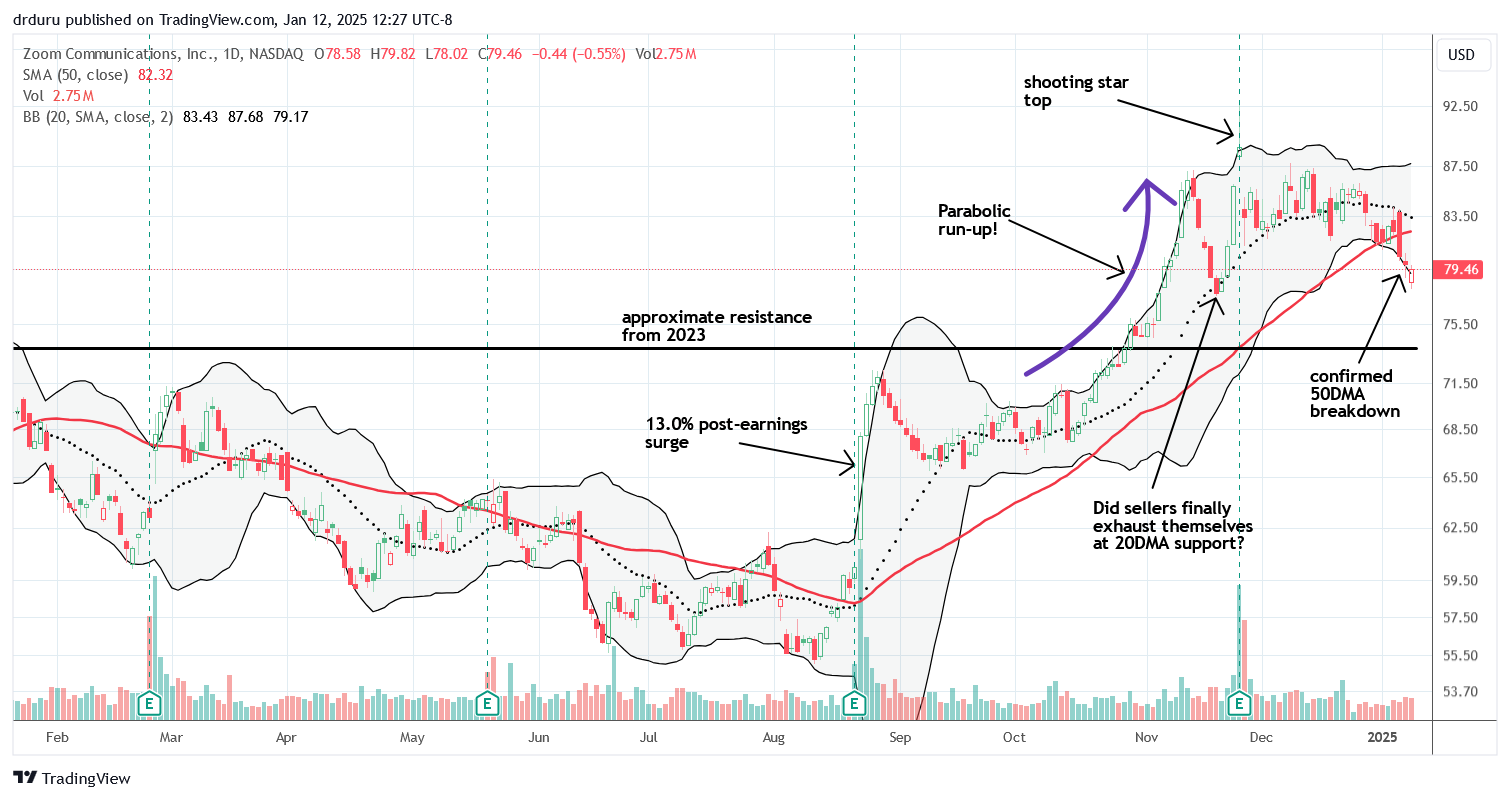
The saga for Zoom Communications, Inc (ZM) took a bearish turn last week. ZM confirmed a 50DMA breakdown in a move that confirms the weakness. ZM topped out after a 6.3% post-earnings loss left behind a bearish shooting star pattern. I have stayed on alert for an opportunity to re-enter ZM. Now, I need to step back and wait out the bearish tidings.
Be careful out there!
Footnotes
Subscribe for free to get email notifications of future posts!
“Above the 50” (AT50) uses the percentage of stocks trading above their respective 50-day moving averages (DMAs) to measure breadth in the stock market. Breadth defines the distribution of participation in a rally or sell-off. As a result, AT50 identifies extremes in market sentiment that are likely to reverse. Above the 50 is my alternative name for “MMFI” which is a symbol TradingView.com and other chart vendors use for this breadth indicator. Learn more about AT50 on my Market Breadth Resource Page. AT200, or MMTH, measures the percentage of stocks trading above their respective 200DMAs.
Active AT50 (MMFI) periods: Day #278 over 20% (overperiod), Day #1 under 30% (underperiod ending 176 days over 30%), Day #11 under 40%, Day #11 under 50%, Day #15 under 60%, Day #116 under 70%
Source for charts unless otherwise noted: TradingView.com
Full disclosure: long SPY put spread, long IWM shares and call option, long NVDA call option, long ARKK, long CAT put spread, long CPRI and short call
FOLLOW Dr. Duru’s commentary on financial markets via StockTwits, BlueSky, and even Instagram!
*Charting notes: Stock prices are not adjusted for dividends. Candlestick charts use hollow bodies: open candles indicate a close higher than the open, filled candles indicate an open higher than the close.


1 thought on “Post-Election Euphoria Fizzling with Oversold In Sight – The Market Breadth”