Housing Market Intro and Summary
What happened in the housing market in October, 2024? A reckoning that I anticipated finally came in the form of sharply lower prices for the shares of home builders. After resisting rising mortgage rates for a month, the stock market lost its appetite. Earnings have brought a dose of reality that suggests a reckoning will top out shares and push new home sales to join the slowdown in existing home sales.
The key messages from the housing data reported in October showed continued weaknesses in existing home sales but sentiment acting as a potential downside cushion:
- The stocks of home builders experienced their second worse month of the year largely thanks to rising mortgage rates and a sobering earnings report from a major home builder.
- Home builder sentiment gained another 2 points. A further strengthening in the future sales component supports a bottoming in sentiment but is complicated by buyers waiting for rates to come back down.
- Single-family housing starts edged higher but building permits slipped.
- Sales of new single-family homes nudged to a new high for the year but remain well below 2021’s high.
- Sales of existing homes resumed their weakness by falling to a fresh 14-year low. Rising inventories are still not stoking demand or bringing prices down.
- California existing home sales again followed the national trend downward. Homes priced above $1M gained in sales while the sale of homes priced below $1M plunged.
- Native-born buyers, not immigrants, are the prime drivers of recent pricing pressures.
- Mortgage rates steadily rose during October and have yet to show signs of plateauing.
Housing Stocks
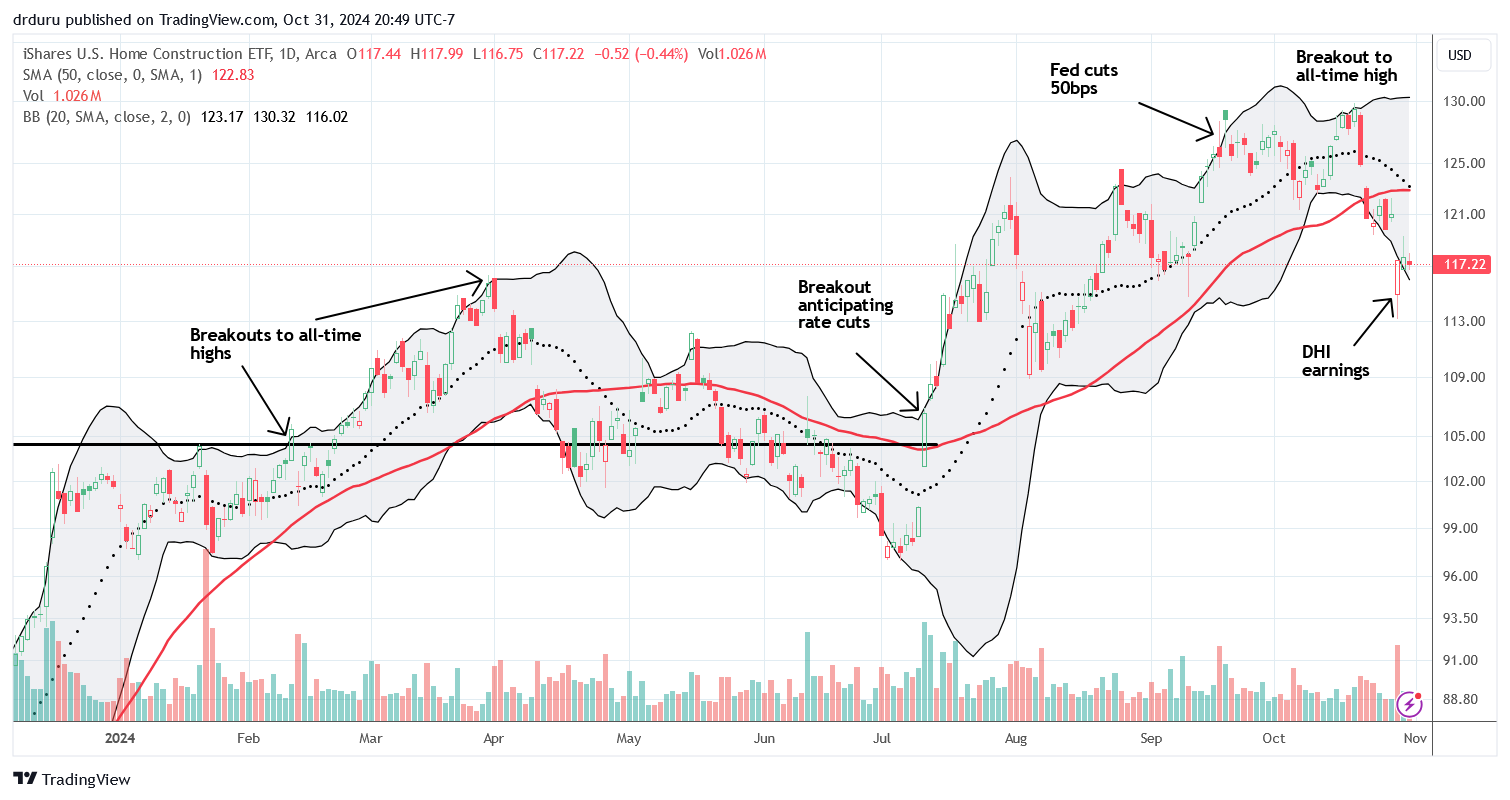
In October, the iShares US Home Construction ETF (ITB) suffered its second worst month of the year. The 7.8% loss started with ITB finally exhausting itself after an all-time high leaned sharply against rising mortgage rates. A confirmed breakdown below the 50-day moving average (DMA) (the red line in the chart below) was solidified by a 2.9% loss in sympathy with poor earnings from D.R. Horton, Inc (DHI). ITB is now holding at support from its September lows and effectively kicks off the seasonally strong period for home builders. My exact starting date is a bit arbitrary, but I always pick a point in October or November. I prefer the location of a major downside event; last week delivered.
Note well that I continue to take pause in light of what I still think is a surprisingly high amount of enthusiasm for the stocks of home builders going into this season. Thus, I am content to keep waiting on my first trade of the season.
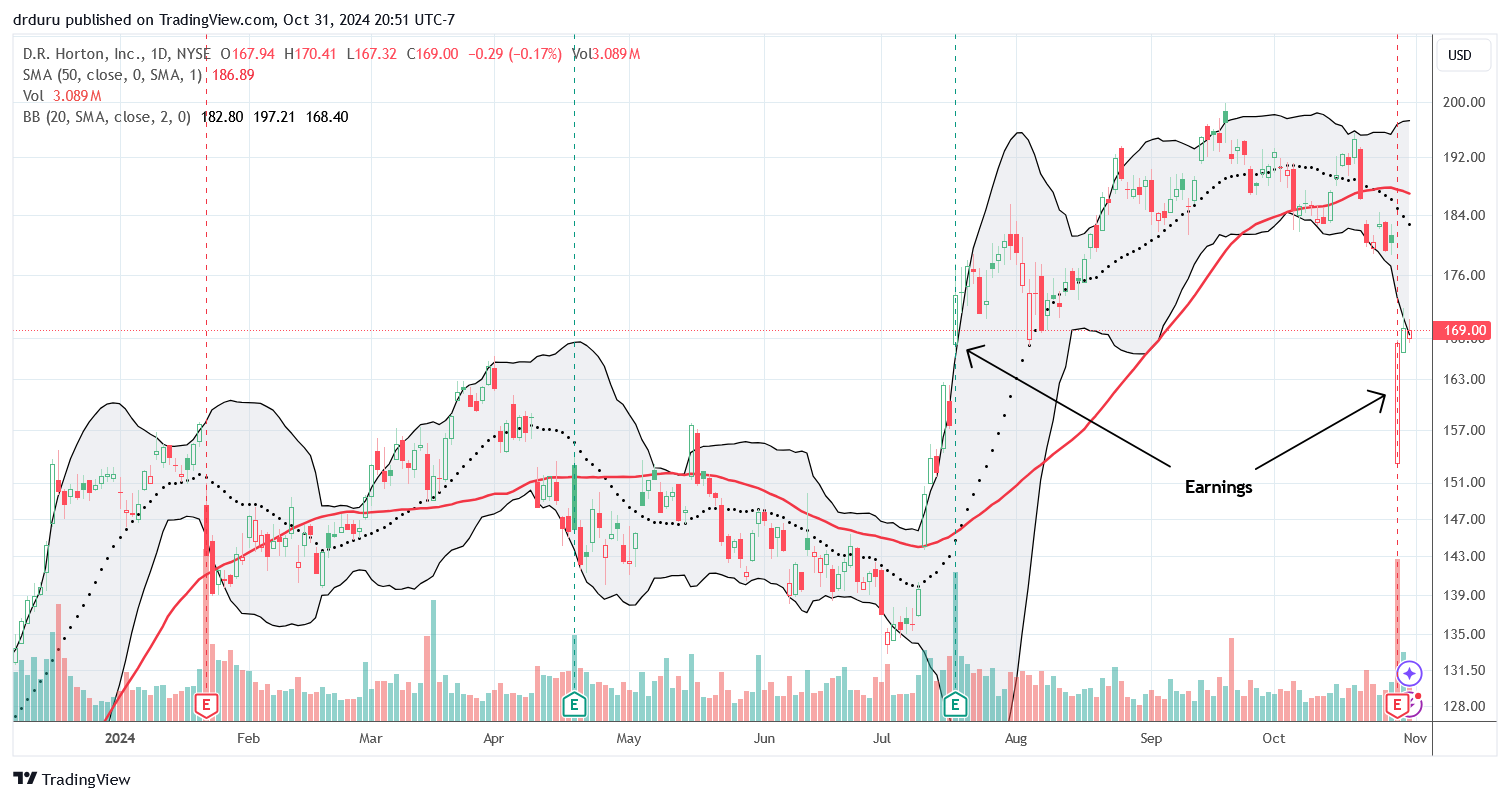
If I were a day trader, I could have flipped D.R. Horton, Inc (DHI) after it fell as much as 15.1% post-earnings. The initial loss was extreme from a technical standpoint given the distance below the lower Bollinger Band (BB) (the curved black line in the chart below). This drop reversed all the gains from July earnings and even approached a full reversal of the July breakout.
DHI guided revenue down for 2025 explaining that “while mortgage rates have decreased from their highs earlier this year, many potential home buyers expect rates to be lower in 2025…We believe that rate volatility and uncertainty are causing some buyers to stay on the sidelines in the near term. To help spur demand and address affordability, we are continuing to use incentives such as mortgage rate buydowns, and we have continued to start and sell more of our homes with smaller floor plans.” Given DHI missed earnings expectations for the quarter, investors can expect worse margin performance in the coming year. Given margins are a key driver of buying interest in builders, I expect the current top in builders to hold firm for quite some time.
DHI should reach a floor in short order given the company’s forecast for strong cash flow and the likely continuation of share buyback activity.
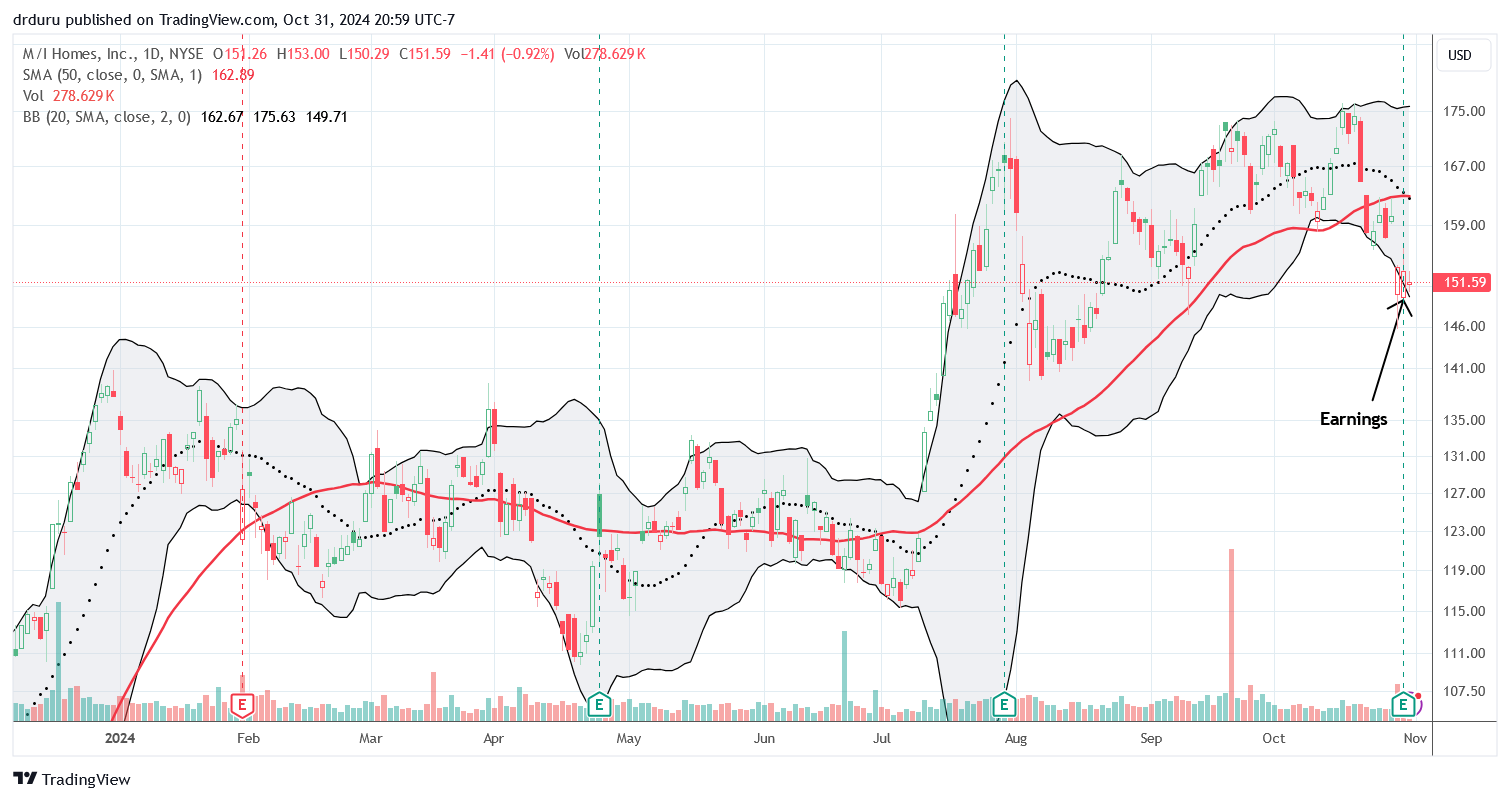
M/I Homes, Inc (MHI) reported earnings the day after DHI reported. MHI survived the test, but looks just as precarious as DHI. In the conference call, the builder tried to offer some reassurance to investors:
“We like where we are, we like our position, really excited about our land position. We’ve grown community count this year. We expect to grow community count next year and beyond. We’re looking to continue to grow the business as we’ve said throughout every single call over the last number of years.
There’s a lot of stuff going on right now. There’s a lot of noise. I think that’s been the common theme of every builder call and it’s because it’s the way it is. But conditions are not bad. Record returns, record profit, decent sales, strong closings, recently we’ve seen a pickup in traffic. It’s just very hard to draw any clear conclusion as to where we are at a moment in time.”
In my last Housing Market update, I insisted that “given the high level of expectations going into last month’s Fed rate cut, I do not expect much more upside for home builders in the short-term…I also expect lofty prices on individual home builders to soften a bit after earnings reports.” The reckoning in share prices is here.
Housing Data
Home Builder Confidence: The Housing Market Index – October, 2024
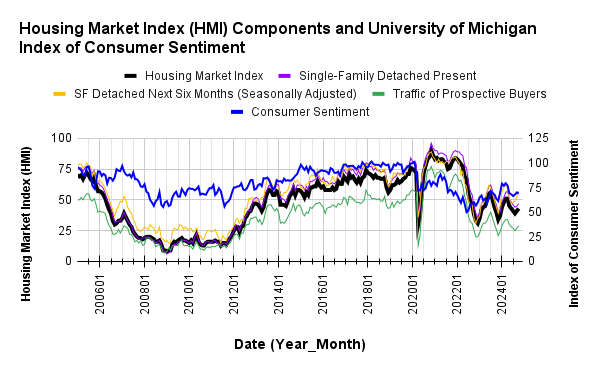
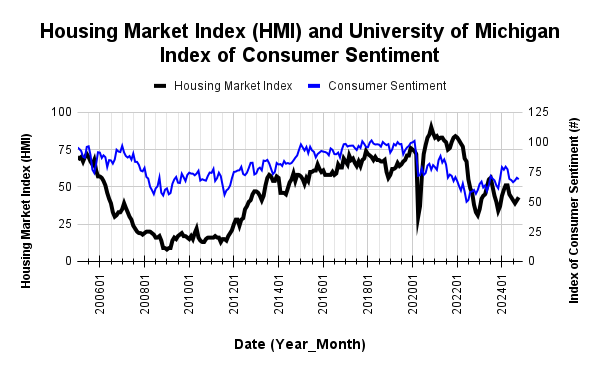
The National Association of Home Builders (NAHB)/Wells Fargo Housing Market Index (HMI) continued a recovery with a second monthly gain. The two point increase from August’s 41 HMI matched the previous increase. The NAHB remains concerned about affordability and expects inventories could tighten once lower mortgage rates motivate more demand while at the same time builders struggle with tight lending conditions. The HMI component for the next 6 months (Single-Family: Next Six Months) started increasing in July and jumped 4 points for October. Thus, the underlying dynamics continue to suggest that HMI has bottomed for the current cycle. This bottoming suggests a cushion exists for the reckoning in the shares of home builders.
Source for data: NAHB and the University of Michigan
After leading builder sentiment higher, consumer sentiment has stalled out.
The 32% share of builders cutting prices is flat with September, down from 33% in August, up from the 31% in July. The share of builders providing incentives decreased from 64% (adjusted) in August to 61% in September and edging up to 62% in October. The average price discount completed the mixed pricing picture by edging back up to 6%.
October’s HMI gain left the Northeast behind. After gaining, 9 points in September, the Northeast retreated 3 points. The South had its biggest one month gain for the year at 3 points. While the South remains the region with the lowest HMI, tied now with the Midwest, I am marginally less worried about the region’s sentiment. The Midwest increased by 2 points, and the West gained 3 points.
New Residential Construction (Single-Family Housing Starts) – September, 2024
In September, single-family housing starts held above the 1M mark at 1,027,000. This was 2.7% above August’s 1,000,000 starts (revised upward from 992,000) and a healthy 5.5% year-over-year gain. Starts were falling with builder sentiment and are now rebounding as sentiment improves about future demand. Just as Hurricane Beryl contributed to weak starts in July, I suspect October’s starts will plunge due to the devastation from Hurricane Milton.
![Housing starts US. Bureau of the Census, Privately Owned Housing Starts: 1-Unit Structures [HOUST1F], first retrieved from FRED, Federal Reserve Bank of St. Louis, October 24, 2024](https://drduru.com/onetwentytwo/wp-content/uploads/2024/10/20241024_Housing-starts-September-2024.png)
After apparently bottoming out over the summer, building permits declined slightly in September. Permits are still down 9.2% from January’s high of the year.
The West was the only region with a year-over-year decline in starts. The South clawed its way back to positive territory. The Northeast surged large double digits for the second straight month. The Northeast, Midwest, South, and West each changed +77.4%, +3.4%, +1.9%, and -0.9% respectively year-over-year.
New Residential Sales (Single-Family) – September, 2024
New home sales increased to a new high for the year while July’s sales lost high of the year status due to a significant downward reduction. September sales increased 4.1% from August to 716,000, a 9.8% year-over-year increase. An uptrend from the 2022 and 2023 lows continues…even as sales in existing homes languish: new home sales continue to eat existing home sales.
![new home sales US. Bureau of the Census, New One Family Houses Sold: United States [HSN1F], first retrieved from FRED, Federal Reserve Bank of St. Louis, October, 2024.](https://drduru.com/onetwentytwo/wp-content/uploads/2024/10/20241024_New-home-sales-September-2024.png)
The median price drifted to $426,300, right in the middle of the year’s range and a 4.7% year-over-year increase. Prices last increased year-over-year in January, 2024. This news is bad for prospective buyers after a year mostly filled with year-over-year declines.
There are still no definitive trends in the distribution of sales across the price ranges despite what I have assumed is an on-going scramble for affordable homes. For September, the $300,000 to $399,999 range lost three percentage points and the lowest price tier gained a percent. On the other side, the $500,000 to $599,999 and $800,000 to $999,999 price ranges each gained a percentage point.
September’s inventory declined to 7.6 from 7.9 (revised up) months of sales. For comparison, a year ago inventory sat at 7.5 months of sales. Absolute inventory has remained flat for most of the year, but it is just below the peak from 2022. I expect a breakout to the upside will accompany lower prices, but prices may now be on the rise again.
Regional sales in September experienced another wide range. The Northeast, Midwest, South, and the West changed -22.2%, +14.9%, +14.7%, -10.9% respectively.
Existing Home Sales – September, 2024
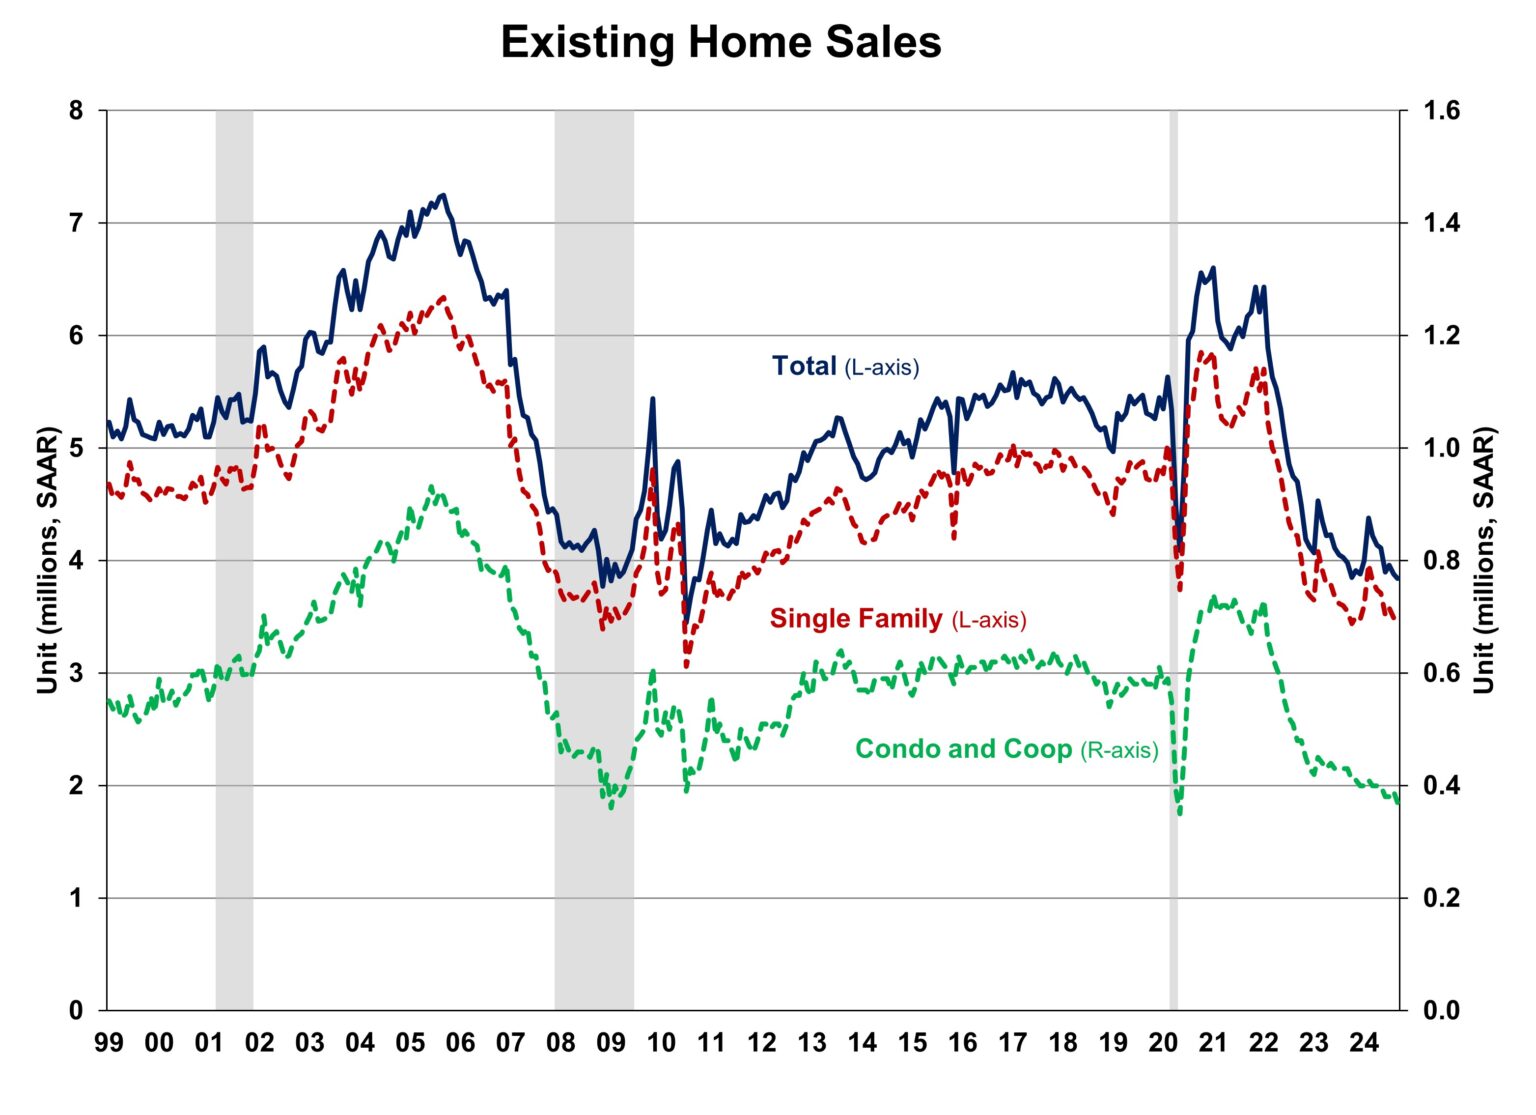
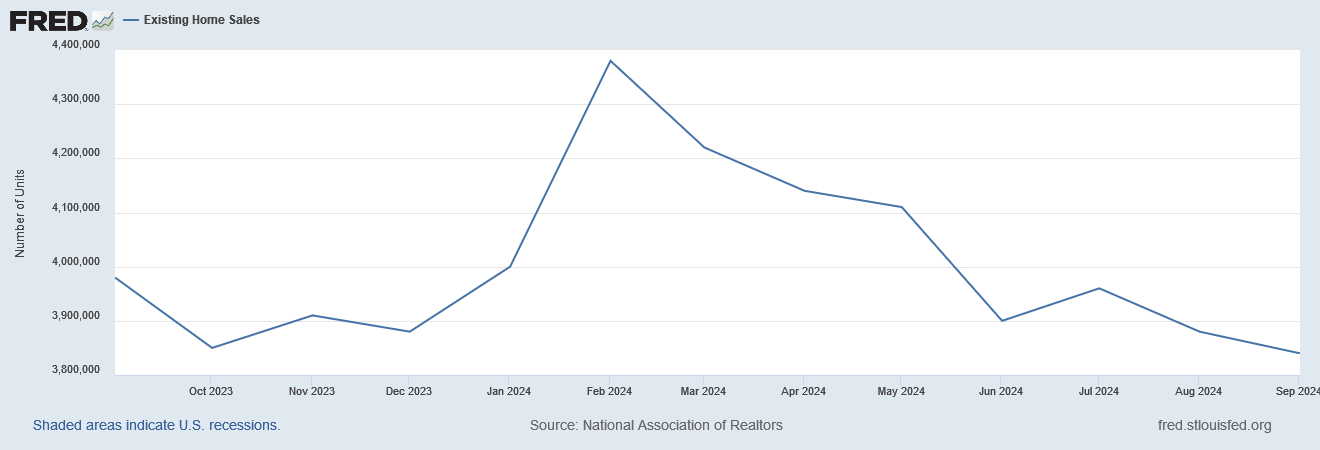
Existing home sales continued its 2024 downtrend. Everything about the data for existing home sales signals an ongoing slowdown (that could eventually infect new home sales given the signal from DHI). Declining mortgage rates and increasing inventory once again failed to arrest the overall downtrend in sales from the peak in February, 2024. The National Association of Realtors (NAR) remains as hopeful as ever, contrary to the trends, with a very generous description of the current sales pace: “Home sales have been essentially stuck at around a four-million-unit pace for the past 12 months, but factors usually associated with higher home sales are developing…There are more inventory choices for consumers, lower mortgage rates than a year ago and continued job additions to the economy.”
Surprisingly, the NAR went on to guess that the election is causing buyers to pause (a claim M/I Homes would support). This explanation contradicts the steady increase in new home sales. Unless new home sales would be even better without the election, there is no reason to believe existing home buyers are more sensitive to the election than existing home buyers.
The seasonally adjusted annualized sales in September of 3.84M declined 1.0% from August’s 3.86M. Year-over-year, sales declined 3.5% (down from 3.98 million in September 2023). Existing home sales dropped to a fresh 14-year low.
(For historical data from 1999 to 2014, click here. For historical data from 2014 to 2018, click here) Source for chart: National Association of Realtors, Existing Home Sales© [EXHOSLUSM495S], retrieved from FRED, Federal Reserve Bank of St. Louis, October 30, 2024
September’s absolute inventory of 1.39M homes was up 1.5% month-over-month and up a whopping 23.0% year-over-year. According to the NAR, “Unsold inventory sits at a 4.3-month supply at the current sales pace, up from 4.2 months in August and 3.4 months in September 2023.” Note again that the surge in inventory from last year’s levels did not produce a boost in sales as the NAR has long expected and continues to expect. This ongoing divergence is another sign of a slowing market amid rising prices.
The median sales price of an existing home decreased from the all-time high two months ago at $426,900 to $404,500 in September. September’s median price fell 1.2% month-over-month but grew 3.0% year-over-year, generating the 14th consecutive year-over-year gain. This ongoing uptrend in price continues to weigh on the market for existing homes.
The average time on the market for an existing home increased to 28 days in September, up from 26 days in August and up significantly from the 21 days in September 2023.
The share of sales to first-time home buyers remained at 26% in September, matching the all-time low from August 2024 and November 2021, and down from 27% in September 2023. The NAR’s 2017 Profile of Home Buyers and Sellers reported an average of 34% for 2017, 33% for 2018, 33% for 2019, 31% for 2020, 34% for 2021, 26% for 2022, and 32% for 2023.
The South continues to be a region of notable weakness. It was the weakest region in June and continued to decline in August and September. Three regions declined year-over-year in September, while the West experienced a sales gain. The regional year-over-year changes were: Northeast -6.1%, Midwest -5.3%, South -5.5%, West +5.6%.
Every region continued to experience a year-over-year price increase. Weakening price trends in the South persist: Northeast +6.0%, Midwest +5.0%, South +0.8%, West +1.7%.
Single-family existing home sales declined by 0.6% from August to 3.47M in September and dropped by 2.3% year-over-year. The median price of a single-family home was $409,000, up 2.9% year-over-year but down 1.2% month-over-month, marking the third decline in a row after five consecutive months of increases. The plunge in condominium and co-op sales continues to be notable: 5.1% month-over-month and 14.0% year-over-year.
California Existing Home Sales – September, 2024
The California Association of Realtors (C.A.R.) pointed to a wait-and-see attitude with buyers as a driver of poor existing home sales in California: “economic uncertainty and hopes for lower interest rates may have caused many buyers to hold off on a home purchase.” This explanation for slowing sales makes more sense than the NAR’s election-related attribution.
According to the latest report from the California Association of Realtors, existing single-family home sales totaled 253,010 in September, marking a 3.4% decrease from August and a 5.1% year-over-year increase.
The $1M price threshold continues to define California’s market narrative. According to CAR, “While the sales pace for the $1 million-and-higher price segment remained moderately low in September at 3.9%, sales in the sub-$500,000 market continued to underperform, dropping 8.6% below the year-ago level.” The median home price in September decreased 2.3% month-over-month to $868,150 but rose year-over-year by 2.9% to $843,500. This year-over-year increase marked the 15th consecutive month of gains.
The median time it took to sell a home in California rose to 24 days in September, up from 22 days in August and from 18 days a year ago.
The statewide sales-price-to-list-price ratio remained at 100.0% for the eighth month in a row, unchanged from 100.0% in September 2023. The price per square foot for an existing single-family home in California was $424 in September, a 1.9% increase from a year ago.
New active listings increased for the ninth straight month, while the Unsold Inventory Index (UII) also rose. The UII increased from 3.2 months in August to 3.6 months in September and was up from 2.8 months a year ago. Active listings grew 36.0% year-over-year, marking the eighth consecutive month of annual gains and the seventh straight month of double-digit increases in active listings. Just as in the rest of the nation, improving inventory levels did not motivate a better sales pace.
Home closing thoughts
Native Born Buyers, Not Immigrants, Are Largely Responsible for Rising Home Prices
In “The Role of the Recent Immigrant Surge in Housing Costs“, the Joint Center for Housing Studies of Harvard University (JCHS) threw its analytical and data-driven hat into the debate on the sources of rising housing costs. The Center concluded that “the timing of the recent surge in immigration…does not line up with the high growth in both rents and home prices that happened at the start of the pandemic. Immigrants play a role in household growth, sometimes to a substantial degree, but housing demand during the pandemic has been primarily shaped by native-born household growth in a time of constrained housing supply.”
Specifically, “foreign-born householders accounted for 25 percent of household growth from 2019–2023 amid particularly strong native-born household growth.” The Center notes that the recent surge in immigration coincided with slowing price growth. This effect of course was driven by the Federal Reserve’s tightening of monetary policy by hiking interest rates.
Housing market analysts have long anticipated the impact of a bulge of household formation from millennials. That time arrived over the past 10 years and accelerated when the Federal Reserve slashed interest rates back to zero in the wake of the pandemic. Fortunately, immigrants have helped to expand the housing supply. According to the JCHS, “immigrants accounted for 34 percent of those who worked in construction trades in 2023, far higher than their 18 percent share of the overall workforce.”
Spotlight on Mortgage Rates
The Mortgage Bankers Association (MBA) reported five weekly decreases in mortgage applications in October as mortgage rates steadily rose. The earlier positive year-over-year trend in applications may have ended with a confirmation of buyers going on pause waiting for lower rates. In July, new home mortgage purchase applications soared 9.5% year-over-year, increased 4.5% in August and soared again 10.8% in September. The year-over-year increase was the 20th consecutive month of such gains.
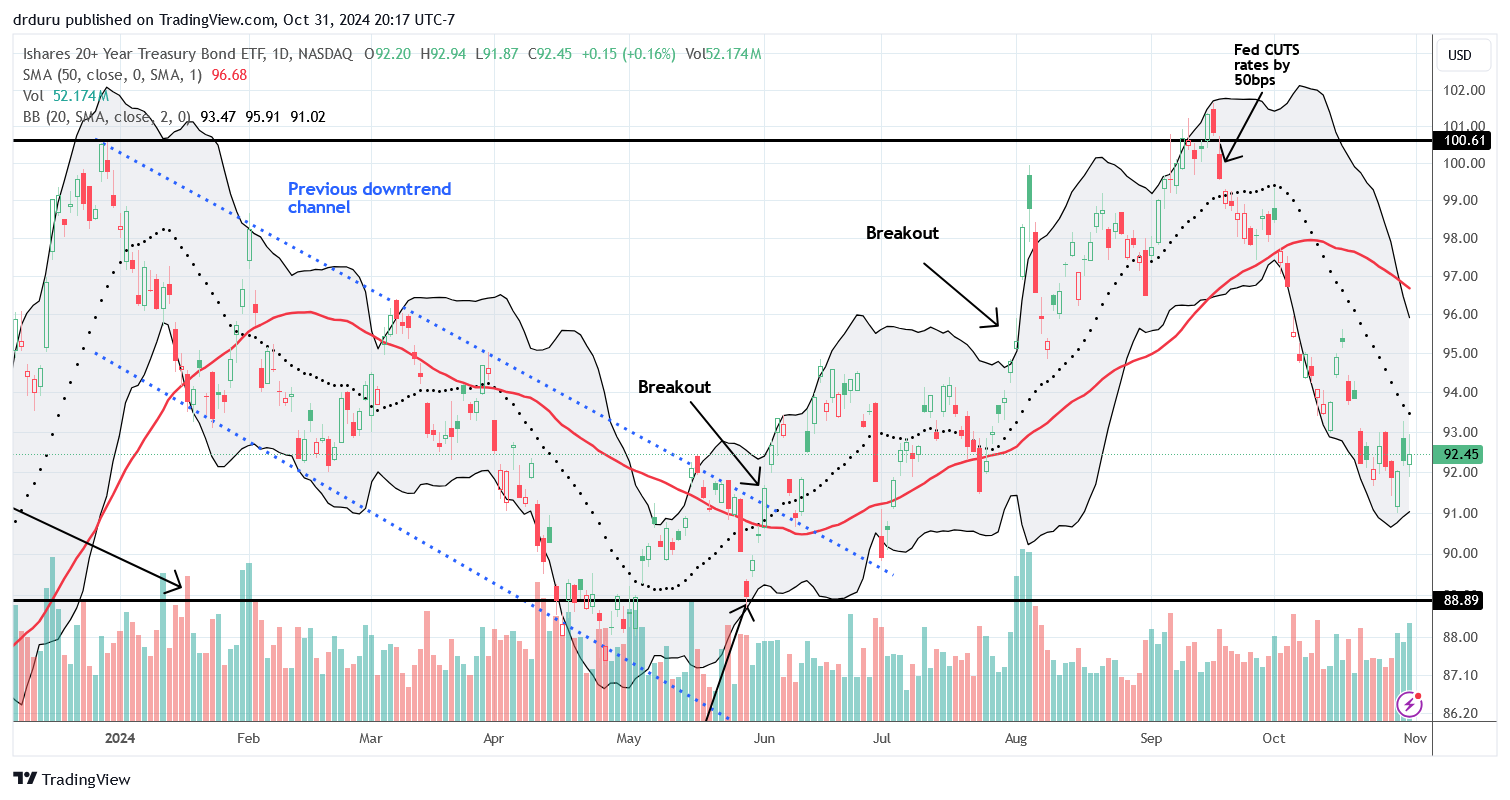
Mortgage rates abruptly ended a steep descent off the May peak. These rates returned from the 2023 low set in January to a 3-month high. Home buyers looking at this surprising turn of events are likely waiting for what they likely expect to be an inevitable rate reduction. However, strong economic data mean that the Federal Reserve will be in no rush to cut rates. Moreover, these short-term rate cuts may convince the bond market to keep long-term rates elevated in the context of a strong economy and the prospects of a new administration ramping up Federal government deficit spending in the next 4 years.
The chart below of the iShares 20+ Year Treasury Bond ETF (TLT) shows bond market’s contrary response to the Fed’s rate hike (lower prices mean higher rates). Sellers have even reversed all of July’s breakout that anticipated the eventual rate cut.
![Freddie Mac, 30-Year Fixed Rate Mortgage Average in the United States [MORTGAGE30US], retrieved from FRED, Federal Reserve Bank of St. Louis; October 31, 2024.](https://drduru.com/onetwentytwo/wp-content/uploads/2024/10/20241031_30-Year-Fixed-Rate-Mortgage-Average-in-the-United-States.png)
Be careful out there!
Full disclosure: long ITB shares



1 thought on “What Happened in the Housing Market – Reckoning”