

The simple answer is yes! The data show that a worse than average August for the S&P 500 (SPY) increases the likelihood of a worse than average September. I use average to mean the average maximum drawdown as calculated and analyzed in “How to Trade During the Stock Market’s Most Dangerous Months“. In this case, “worse” means a negative number less than the average and “better” means a negative number higher than the average. I was disappointed by this result because I was hoping that an extreme month relieves the selling pressure in the stock market for the subsequent month. Instead, it seems August’s extra selling pressure tells us to brace for greater than average selling pressure in September!
This analysis is of particular interest because August, 2024 delivered an extreme maximum drawdown of -6.1%, the 13th largest drawdown for August for the S&P 500 since 1950 (74 years of data). If you are a bull, you want to believe that the stock market let off steam, so to speak, and thus is less prone to another large drawdown in September. If you are a bear, you want to believe that August’s selling was a warning of more to come. Both the numbers and the statistics appear to be in favor of the bears.
Let’s take a look at the detailed analysis.
The Analysis of Worse Than Average
The basis of this work comes from my analysis of the monthly maximum drawdowns for the S&P 500 (SPY) referenced above. August, September, and October have the worst maximum drawdowns (note I did not examine the statistical significance of the differences across months). I went back to the core dataset and segmented the August and September data as follows:
| Month | Maximum Drawdown Relative to the Average for the Month | Number of Occurrences 1950 to 2023 |
| August | Below | 30 |
| August | Above | 44 |
| September | Below | 27 |
| September | Above | 47 |
I further segmented the September data conditioned on the August maximum drawdown.
| Number of times September’s maximum drawdown is below the month’s average | Number of times September’s maximum drawdown is above the month’s average | |
| When the August maximum drawdown is below the month’s average drawdown (30 times) | 16 | 14 |
September’s maximum drawdown is above average 64% of the time (= 47/ (27 + 47)). Yet, when only looking at years when August has a below average maximum drawdown, September’s maximum drawdown is above average only 47% of the time. Thus, September is more likely to deliver a worse than average performance.
The Statistical Significance
The analysis does not end there {See epilogue below for an important clarification and correction}. Only a statistically significant difference is truly actionable. Statistical significance means that these differences are not likely the result of random chance. In other words, the differences could be predictive and not just descriptive.
At this juncture, let’s turn to the data analyst function in ChatGPT (4.0) for help. I gave ChatGPT the following prompt (emphasis mine):
“I need a test of statistical significance for the following scenarios measuring maximum monthly drawdowns in the S&P 500 since 1950. August has had a below average maximum drawdown (negative percentage) 30 times. August has had an above average maximum drawdown 44 times. September has had a below average maximum drawdown (negative percentage) 27 times. September has had an above average maximum drawdown 47 times. Conditioned on an August with a below average maximum drawdown, September has had a below average maximum drawdown 16 times and an above average maximum drawdown 14 times. Thus, a below average maximum drawdown August, decreases the likelihood of an above average maximum drawdown in September. What is the statistical significance of this finding? Show all your work in detail.“
ChatGPT executed the following steps:
- Build a contingency table.
- Create the hypothesis.
- Calculate the expected frequencies (used as a baseline for the statistical test).
- Calculate the Chi-Square statistic – the test of choice for statistical significance for this particular 2 x2 dataset.
- Calculate the degrees of freedom and critical value for the Chi-Square test.
- Determine whether the null hypothesis can be rejected and thus establish statistical significance.
If you have access to ChatGPT’s data analyst, you can see the numerical details by using the prompt from above. I asked ChatGPT to show its work so I could verify the accuracy of its results and the soundness of its analytical choices. Here are the core results:
The contingency table fills out the remaining scenarios:
| September Below Avg | September Above Avg | Total | |
| August Below Avg | 16 | 14 | 30 |
| August Above Avg | 27 – 16 = 11 | 47 – 14 = 33 | 44 |
| Total | 27 | 47 | 74 |
The hypotheses are as follows:
- Null Hypothesis (H0H_0H0): There is no association between a below-average August drawdown and an above-average September drawdown. The probability of a September drawdown (whether below or above average) is independent of the August drawdown.
- Alternative Hypothesis (H1H_1H1): A below-average August drawdown is associated with a different likelihood of a September drawdown being above or below average.
A rejection of the null hypothesis, allows acceptance of the alternative hypothesis.
The Chi-Square test uses the expected frequencies under the null hypothesis that look as follows:
| Scenario | Expected frequency (normalized by total observations = 74) |
| August Below Avg & September Below Avg | 10.95 |
| August Below Avg & September Above Avg | 19.05 |
| August Above Avg & September Below Avg | 16.05 |
| August Above Avg & September Above Avg | 27.95 |
The resulting Chi-Square statistic equals 6.17, higher than the 3.84 threshold for statistical significance based on the number of degrees of freedom (1) and a .05 threshold for the tolerable odds that these results could be the result of random chance. (Note the test for statistical significance just barely fails with a .01 threshold). Here is ChatGPT’s interpretation and conclusion:
“This suggests that the observed relationship between a below-average August drawdown and a below-average September drawdown is statistically significant. The data provides evidence that a below-average August drawdown decreases the likelihood of an above-average September drawdown.”
Implications
So, apparently, the odds that September’s maximum drawdown is worse than the average -2.9% is 53%. These odds are little different from a coin flip but it is notably worse than the odds in any given year. Moreover, these results cannot predict the specific magnitude of the drawdown. I have not proposed a model for such crystal ball powers. However, these results tell me that buying protection is more likely to pay off and that I should avoid overly aggressive buys BEFORE a notable drawdown event. (I would prefer to buy during oversold conditions per the market breadth trading rules).
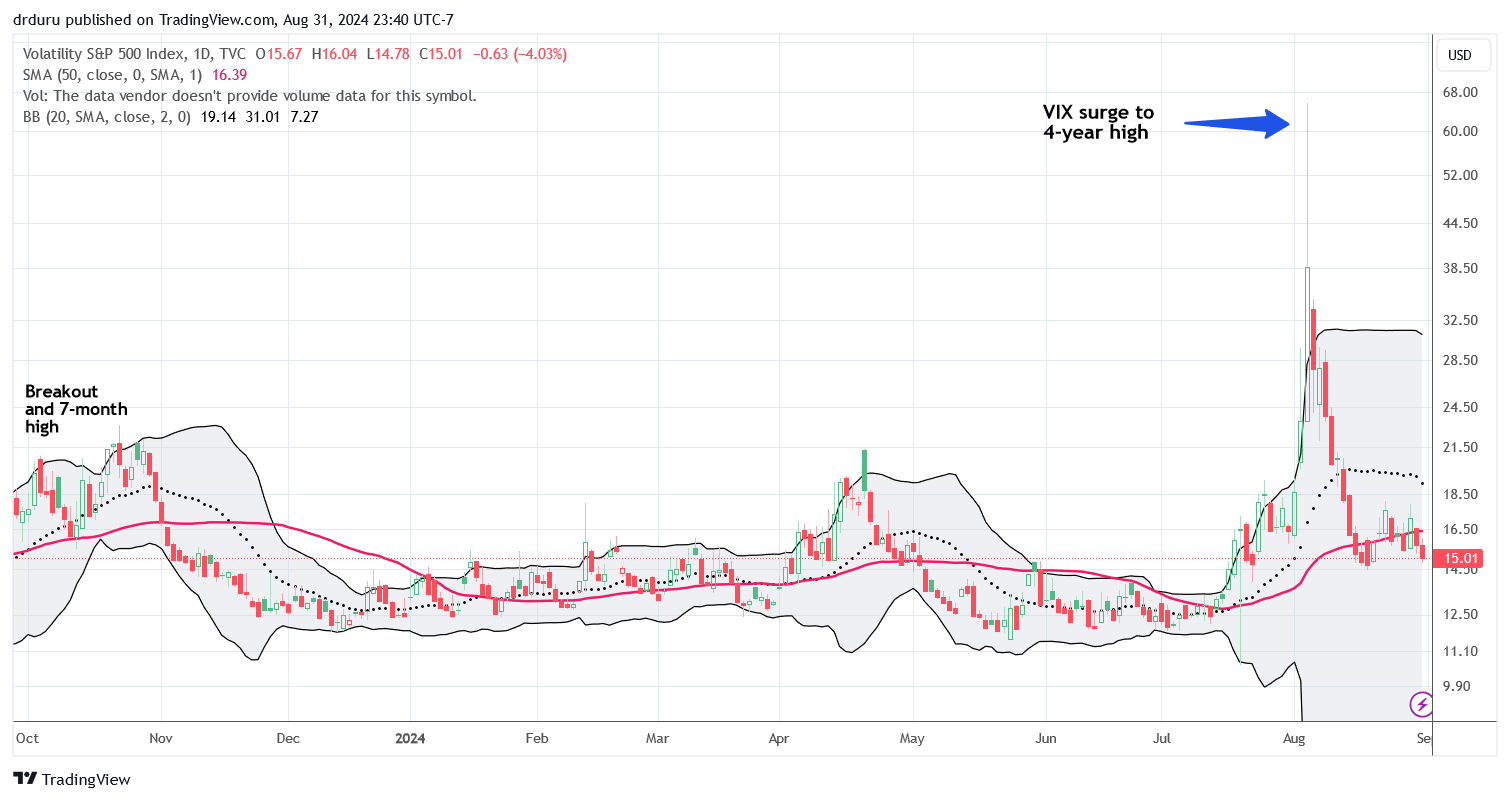
Currently, protection is relatively cheap again with the volatility index (VIX) at 15.0 less than one month after soaring to its third highest close ever. The VIX even looks ready to go lower before jumping higher again.
August delivered a lot of trading drama which also equals opportunity. If September manages to deliver more sharp reversals in investor sentiment, the shifts could pivot around the Federal Reserve’s next decision on monetary policy on September 18th. The market expects at least a 25 basis points (.25%) rate cut. Of course, an unexpectedly strong jobs report for August could roil the market into a state of confusion over the odds for a rate cut. At least inflation looks unlikely to surprise for now…right?
Be careful out there!
Full disclosure: long SPY put spread and puts
Epilogue (June 16, 2025)
I revisited the statistical analysis, curious to see whether ChatGPT would provide the same answer as before. Fortunately, the conclusion remains the same, but the path I presented is not as rigorous as it should have been.
The Chi Square test statistically assesses the relationship between categorical variables. It does not provide a directional assessment. The one-sided Fisher’s exact test provides a directional assessment. The statistical assessment actually used the Fisher test without making it explicit and instead embedded the test in the language of a Chi Square test. Yes, very confusing! Lesson learned about the robustness of ChatGPT’s ability to explain (even run) statistical tests! At least conditions seems to be improving over time.
I did not need the Chi Square test at all for my core question (I see now how I confused ChatGPT last year). The null and alternative hypotheses speak to an associative test and not a directional test. Here is a reset on the question and the statistical assessment.
Prompt (after already providing the data): Is there statistically significant evidence that when August experiences a below-average maximum monthly drawdown, the likelihood of September also having a below-average maximum drawdown increases, compared to when August’s drawdown is above average?
ChatGPT’s response:
✅ Answer:
Yes, there is statistically significant evidence that when August experiences a below-average maximum monthly drawdown, the likelihood of September also having a below-average maximum drawdown increases, compared to when August’s drawdown is above average.
🔬 Statistical Basis
Using your provided data:
| September ↓ | September ↑ | Total | |
|---|---|---|---|
| August ↓ (30 years) | 16 | 14 | 30 |
| August ↑ (44 years) | 11 | 33 | 44 |
- P(Sep ↓ | Aug ↓) = 16 / 30 ≈ 53.3%
- P(Sep ↓ | Aug ↑) = 11 / 44 ≈ 25.0%
To formally test this directional difference in proportions, we apply a one-sided Fisher’s Exact Test, which is appropriate for 2×2 categorical data with moderate sample size and a directional hypothesis.
- Test result: p ≈ 0.0173
- Odds ratio: ≈ 3.42
📌 Conclusion
At the 5% significance level, the result is statistically significant:
A below-average August is associated with more than a 3-fold increase in the odds of September also being below average, compared to years when August was above average.
Thus, the data supports the hypothesis that drawdown weakness in August increases the probability of weakness in September.