

Housing Market Intro and Summary
What happened in the housing market in August, 2024? Financial markets quickly threw out a major downgrade from Citigroup for the housing sector. Hopes for rate cuts from the Federal Reserve continued to impact both the data and stock prices. While the on-going decline in mortgage rates has failed to lift the spirits of home builders, cheaper financing seems to be helping sales stabilize even as prices remain elevated.
Overall, I remain skeptical about the short-term sustainability of the rally (now sharp rebound) in the stocks of home builders. The Fed’s rate cuts may yet reverse sentiment, but that sentiment in turn could pace demand well past supply, drive prices ever higher, and make homes even less affordable. The housing market is in quite a bind and inventory shortages will linger as critical issues. Still, home builders appear as bullish as ever about their prospects.
The key messages from the housing data reported in August included signs of stabilization at lower sales levels despite sinking builder sentiment.
- The stocks of home builders raced to new all-time highs after suffering severe setbacks in the August calamity.
- Home builder sentiment fell for the fourth consecutive month to a new low for the year. The forward-looking component of the sentiment indicator continued to offer a ray of hope with a second monthly gain.
- Single-family housing starts plunged to another new low of the year. Declines in the South drove the bulk of the loss. While hurricane Beryl may have driven much of this loss in Texas, building permits still declined again.
- Sales of new single-family homes surged partially thanks to data revisions. Thus, I am anticipating further, significant revisions.
- Sales of existing homes increased and look able to avoid breaking 2023’s lows. Yet sales of condos and co-ops continued to slip to new lows.
- California existing home sales continued a resumption of a downtrend even as prices continued to trend upward.
- Researchers anticipate climate change will soon reversal U.S. migration from the snow belt to the sun belt.
- The shortage of (affordable) housing in the U.S. has garnered an intensifying spotlight in the media and the political stage.
- Mortgage rates continued a steep descent off the May peak and ended August at a 2 1/2 month low. The debt market is fully anticipating a rate cut cycle from the Federal Reserve.
Housing Stocks
After an astounding 19.3% gain in July, the iShares US Home Construction ETF (ITB) gained just 0.3% in August. Yet, this minimal gain masks a swift recovery from a steep sell-off at the start of August. ITB even stepped ahead of the S&P 500 (SPY) by setting a new all-time high less than three weeks after the August calamity. Investors in home building stocks are threading the needle between rate cuts to match cooling inflation and rate cuts to stave future economic weakness. This rebound also directly contrasts the continuing weakness in builder sentiment.
")
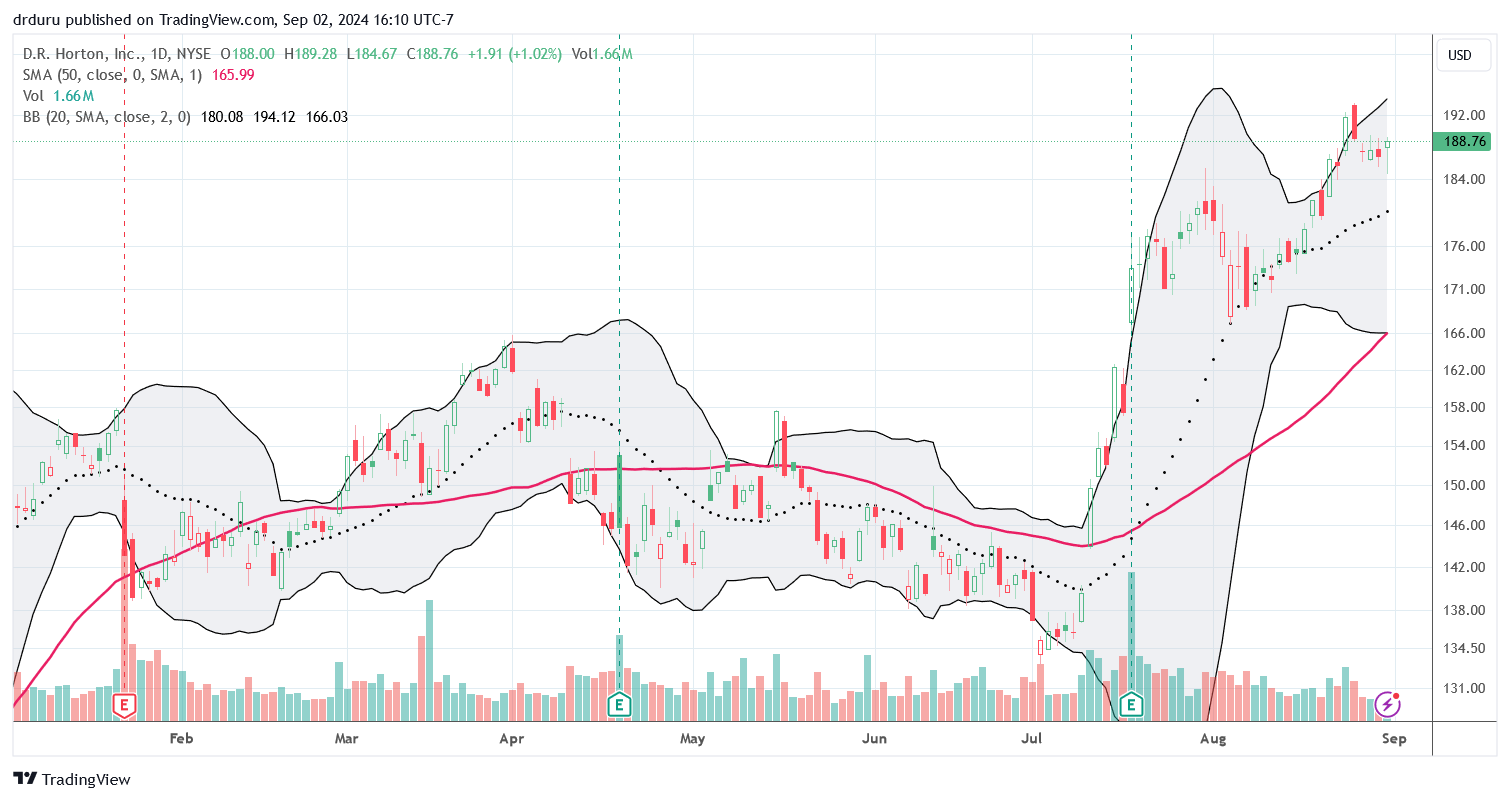
While all the home builder stocks exhibited similar price patterns in August, D. R. Horton (DHI) stood out with new all-time highs starting August 19th. DHI closed the month off its all-time high and looks like it is waiting for the next buy signal.
Housing Data
Home Builder Confidence: The Housing Market Index – August, 2024
The National Association of Home Builders (NAHB)/Wells Fargo Housing Market Index (HMI) dropped two points to 39, its fourth consecutive monthly decline and a fresh low for the year. July’s reading was revised downward by 1 point. The NAHB picked out two drivers of lower sentiment from the standard portfolio of explanations. This time the blame focused on buyers who face affordability challenges, “hesitation” in the face of higher mortgage rates, and higher home prices (note that shelter inflation contributed 90% of the monthly increase in the CPI – consumer price index).
While overall builder sentiment continues to decline, sentiment looking forward over the next 6 months (Single-Family: Next Six Months) improved by one point for the second month. Presumably, this small increase reflects faint hopes that future rate cuts will spur demand. However, the Traffic of Prospective Buyers fell another 2 points to a new low for the year. This reduced traffic may be a result of buyers waiting for future rate cuts before buying. However, mortgage rates have already declined rapidly likely in anticipation of rate cuts.
/Wells Fargo Housing Market Index (HMI) and the University of Michigan Index of Consumer Sentiment")
Source for data: NAHB and the University of Michigan
Consumers are subtly turning away from the on-going sinking feeling among home builders. Better sentiment from consumers could eventually drag builder sentiment higher.
All three components of the HMI remain well synchronized month-to-month even with the SF Detached Next Six Months increasing by a point.

Builders felt yet further pressure to reduce prices in August. The 33% share of builders cutting prices is up from 31% in July, 29% in June, and 25% in May. The share of builders providing incentives increased from 61% to 63%, the highest share since April 2019. Despite these converging pricing pressures on builders, the average price discount somehow stayed flat at 6% for the fourteenth straight month.
The South was the hardest hit region for sentiment in August with a 4 point drop and new low for the year. The Midwest and the West stayed flat with July. The West is at its low of the year. After plunging from 62 in June to 47 in July, the Northeast “only” fell one more point in August.
New Residential Construction (Single-Family Housing Starts) – July, 2024
In June, single-family housing starts fell to a new low of the year. A 14.1% plunge from there took starts into the trough from 2023. July starts hit 851,000, a 14.8% year-over-year decline. This large drop in starts wiped out for good my earlier assumption that starts would stabilize around the 1M mark. Starts are falling with builder sentiment, so August’s starts could fall even deeper into the 2023 trough. The NAHB explained that “high interest rates for construction and development loans as well as ongoing challenges regarding labor shortages and higher prices for many building materials continued to slow the building market this summer.”
![US. Bureau of the Census, Privately Owned Housing Starts: 1-Unit Structures [HOUST1F], first retrieved from FRED, Federal Reserve Bank of St. Louis, August 16, 2024](https://drduru.com/onetwentytwo/wp-content/uploads/2024/08/20240816_Housing-starts-July-2024.png "Housing starts")
A peaking in builder permits continues to reinforce the peaking in housing starts and builder sentiment. Building permits in March ended an impressive 13-month streak of sequential gains with a 4.2% decline from February. July continued the sequential decline with a slight 0.1% drop from June. These sequential declines are decelerating so permits could bottom out in coming months. If so, I will assume that sentiment and starts are bottoming as well…just in time for the seasonal trade on home builders.
The year-over-year change was negative for the first time since May, 2023. The year-over-year gain peaked in December at 36.9%. July was down to a -1.6% change.
The Midwest was the only region to maintain a year-over-year gain in starts. All three other regions suffered double digit declines. The Northeast, Midwest, South, and West each changed -19.0%, +8.2%, -18.4%, and -16.8% respectively year-over-year.
While some analysts blamed weak starts on Hurricane Beryl which hit Texas in July, the NAHB made no mention of it. So, I want to see what happens for August starts before dismissing July’s weakness. The drop in the South, where Texas sits, was indeed precipitous. Starts in the South plunged 22.9% from June, the 7th largest sequential drop since 1984. For comparison, starts in the West dropped just 3.0% from June. The West’s large year-over-year drop was exaggerated by an unfavorable comparable due to a large spike in starts in July, 2023.
New Residential Sales (Single-Family) – July, 2024
May’s new home sales numbers confirmed the 2024 spring selling season as a “bust”. However, with a significant upward revision from 617,000 to 668,000 in sales for June, the summer suddenly looks like a trough. This trough is created by a 5.6% month-over-month gain taking July new home sales to 739,000, a 1-year high and 10.6% year-over-year gain. This jump surprises me given what should have been an extended pause waiting for the Fed to start cutting rates. Thus, I expect downward revisions in the months to come. Note that mortgage rates have declined sharply in anticipation of Fed rate cuts.
![US. Bureau of the Census, New One Family Houses Sold: United States [HSN1F], first retrieved from FRED, Federal Reserve Bank of St. Louis, August 28, 2024.](https://drduru.com/onetwentytwo/wp-content/uploads/2024/08/20240828_New-home-sales-July-2024.png "new home sales")
The median price pushed further away from the year’s lows to $429,800, a 1.4% year-over-year decline. The year-over-year changes have flattened out for the last several months.
New home sales shifted sharply to the $500,000 to $599,999 price range relative to June. Year-over-year, the biggest shift occurred with a reduction in share for the $400,000 to $499,999 price range. There no longer seem to be any particular trends in the distribution of sales across the price ranges despite what I have assumed is an on-going scramble for affordable homes.
July’s inventory was 7.5 months of sales. Previous readings were significantly revised downward such that what previously looked like an uptrend turned out to be more of a meandering around the 8.4 level. For comparison, a year ago inventory sat at 7.3 months of sales. Absolute inventory has remained remarkably flat for most of the year around the peak from 2022 which in turn was a 14-year high. In July, this inventory decreased from 467,000 to 462,000. As a reminder, total inventory remains low by historical standards given the dearth of existing home inventory.
Regional sales in July swung with a much smaller range than the last two months. The Northeast, Midwest, South, and the West changed +3.3%, +17.1%, +2.2%, and +9.0% respectively.
Existing Home Sales – July, 2024
It was a close call, but it looks like existing home sales should avoid breaking below last year’s low as inventory seems ready to improve alongside declining mortgage rates.
The seasonally adjusted annualized sales in July of 3.95M increased 1.3% from June’s 3.9M (revised up from 3.89M) while decreasing 2.3% year-over-year. A 4-month slide in existing home sales came to an end but overall sales still look sluggish.

(For historical data from 1999 to 2014, click here. For historical data from 2014 to 2018, click here) Source for chart: National Association of Realtors, Existing Home Sales© [EXHOSLUSM495S], retrieved from FRED, Federal Reserve Bank of St. Louis, August 30, 2024

While single family existing home sales may have bottomed, condo and coop sales continue to slip. The NAR finally provided an explanation for this on-going weakness: “rising maintenance and insurance costs have lessened the appeal for condominiums”. I now want to know where these buyers are going instead.
May’s absolute inventory of 1.33M homes was up 0.8% month-over-month and up 19.8% year-over-year. According to the NAR, “Unsold inventory sits at a 4.0-month supply at the current sales pace, down from 4.1 months in June but up from 3.3 months in July 2023.” Note again that the surge in inventory from last year’s levels did not produce a boost in sales as NAR expected. Instead, this divergence is another sign of a slowing market amid rising prices.
The persistent price run-up almost regardless of market conditions has weighed on the overall market. The median sales price of an existing home fell 1.0% from its all-time high of $426,900. An increase of 4.2% year-over-year created the 13th straight year-over-year gain. This lapping of a full year of price increases firmly establishes an on-going uptrend.
The average time on market for an existing home increased to 24 days, up from 22 days in June but significantly down from the 38 days in February. The average time was 20 days a year ago.
The share of sales to first-time home buyers stayed flat with June at 29%, down from 30% a year ago. I remain surprised that the share is not lower given pricing pressures and limited inventories. The NAR’s 2017 Profile of Home Buyers and Sellers reported an average of 34% for 2017, 33% for 2018, 33% for 2019, 31% for 2020, 34% for 2021, 26% for 2022, and 32% for 2023.
The South has become a region of notable weakness. It was one of two regions to experience a decline in year-over-year sales. The South was the weakest region in June. The regional year-over-year changes were: Northeast +2.1%, Midwest -5.2%, South -3.8%, West +1.4%.
As usual, every region experienced a year-over-year price increase. The regional year-over-year price changes were yet again substantial for the Northeast: Northeast +8.3%, Midwest +4.5%, South +2.3%, West +3.4%.
Single-family existing home sales increased 1.4% from June and declined on a yearly basis by 1.4%. The median price of $428,500 was up 4.2% year-over-year and down 1.0 % month-over-month, ending 5 straight months of sequential increases.
California Existing Home Sales – July, 2024
The California Association of Realtors (C.A.R.) sees inventory loosening with a decline in mortgage rates. The C.A.R. expects on-going improvements: “With mortgage rates likely to moderate in coming months, further improvement in the supply side could be observed in the market for the rest of the year as the lock-in effect continues to ease.” As a reminder, the lock-in effect has seized up the existing home market as current homeowners have been understandably reluctant to exchange rock bottom mortgage rates for today’s much higher ones. The association also repeated its expectations for a strong second half of the year conditioned on expanding inventory and continued declines in mortgage rates.
According to the latest report from the California Association of Realtors (C.A.R.), existing single-family home sales totaled 279,810 in July, marking a 3.6% increase from June and a 4.1% year-over-year increase. The Far North was the only region which lost sales year-over-year (a marginal -0.5%).
The $1M price threshold continues to define the housing market narrative in California. Homes priced over $1M continue to drive California’s median price higher as availability continues to favor higher-priced homes. According to CAR, “$1 million-and-higher segment rose year-over-year in July by 24.5 percent, while sales in the sub-$500,000 segment dropped 1.6 percent. While sales of homes priced above $1 million were down for the second straight month, they made up 35.4 percent of all sales in July, near the recent high recorded in May 2024.” The median home price in July decreased 1.6% to $886,560. Year-over-year the changes still point upward with a 6.5% increase from the $832,530 median price in July, 2023, a thirteenth consecutive month of year-over-year gains.
The median time it took to sell a home in California increased to 20 days from 18 days in June, 16 days in May and 16 days a year ago.
The statewide sales-price-to-list-price ratio was 100.0% for the sixth month in a row, also unchanged from 100.0% in July 2023. The price per square foot for an existing single-family home in California was $437 in July, a 7.1% increase from a year ago.
Although new active listings soared 19.5% year-over-year (significantly higher than June’s pace), the Unsold Inventory Index (UII) declined thanks to increased demand. The UII decreased from 3.0 months in June to 2.9 months in July and 2.5 months a year ago. Active listings increased 39.0% year-over year, a one and a half year high and the sixth month in a row with a year-over-year gain.

Home closing thoughts
Don’t Pack Your Bags for the Sun Belt Just Yet!
In “Snow Belt to Sun Belt Migration: End of an Era?” researches from the Federal Reserve Bank of San Francisco describe how U.S. migration patterns have been favoring the “snow belt” over the “sun belt” for the last 50 years. Specifically, “in the latest full decade, 2010-2020, both county population growth and county net migration rates were essentially uncorrelated with the historical means of either extreme heat days or extreme cold days.” They attribute a large part of the change to climate change. That is, the increasing temperatures in the sun belt are making the region less and less attractive relative to other cooler parts of the country. These changes should also help mitigate the impact of climate change by reducing the numbers of people exposed to excessive heat. The researchers anticipate a full reversal in migration patterns as heat extremes increase in frequency.
Explaining the Housing Shortage
CNBC reports that the U.S. is short 20 million housing units. About half the new home sales in the U.S. are in 10 cities, four of which are in Texas. The homebuilding industry is increasingly dominated by a few large builders, with the top ten controlling more than half of new homes in 49 of 50 metro regions, reducing competition. These top ten have 50% market share, with D.R. Horton, Inc (DHI) alone controlling 15% of the market (refer to the stock chart posted earlier!).
One guest surprisingly claimed that the time for a builder to deliver a home has gone from “weeks to months”, despite as Diana Olick from CNBC points out in the next frame that builders have simplified models. The segment ends with a primer on the housing plans proposed by the Democratic and Republican parties. The same person who complained about lower productivity and share dominance acknowledged that the number of permits given to builders also constricts the flow of housing.
Conclusion: Resolving the housing shortage will take a long time due to the cumulative effects of decades of under-building, complex regulations, and ongoing high housing demand.
(Review specific data on builder concentration in “Top 10 Builder Market Shares for 2023” from the NAHB.)
“How to fix a housing shortage”
NPR’s Planet Money broadcast its own report on the drivers of the inventory shortage in the U.S. housing market. The story focused on Minnesota which broke through local and environmental resistance with state legislation which prevents challenges to comprehensive city-wide plans. The litany of blockers to new housing is quite familiar: NIMBYism (not in my backyard), zoning that favors single-family homes, and environmental challenges that produce significant construction delays even after a developer has met the letter of the law of existing regulations.
Spotlight on Mortgage Rates
The Mortgage Bankers Association (MBA) reported three weekly increases versus one weekly decrease in mortgage applications in August. In July, new home mortgage purchase applications soared 9.5% year-over-year. The year-over-year increase was the 18th consecutive month of such gains.
Mortgage rates continued a steep descent off the May peak. These rates are now at a 2 1/2 month low. The mortgage market is clearly anticipating rate cuts from the Federal Reserve.
![Freddie Mac, 30-Year Fixed Rate Mortgage Average in the United States [MORTGAGE30US], retrieved from FRED, Federal Reserve Bank of St. Louis; September 2, 2024.](https://drduru.com/onetwentytwo/wp-content/uploads/2024/09/20240902_30-Year-Fixed-Rate-Mortgage-Average-in-the-United-States.png)
Be careful out there!
Full disclosure: long ITB shares,