

Housing Market Intro and Summary
What happened in the housing market in May, 2024? Homebuilders suddenly soured on the prospects for the housing market. In my previous Housing Market Review, I pointed out signs of topping and sales headwinds. The data in May delivered a picture of broadening weakness as a follow-through to the warnings in April. Sales in California and mortgage applications for new homes provided the best glimmers of a potential change in prospects.
- The stocks of home builders continued to roll over and and show various forms of weakness.
- After flattening in April, homebuilder sentiment plunged back into negative territory in April. The Southern region continued to drag on sentiment.
- Single-family housing starts continue to stabilize around the 1M level. However, building permits look like they have finally topped out.
- While new home sales started the spring selling season with impressive gains, April failed to follow-through. The spring selling season now looks like it will be much weaker than a year ago.
- Existing home sales suffered a second monthly setback and added to a picture of broadening weakness in the housing market.
- A sudden and surprising surge in housing activity in California was the main bright spot for exiting home sales.
- A new index on housing costs provided a fresh reminder of national affordability challenges.
Housing Stocks
The iShares US Home Construction ETF (ITB) recorded its last all-time high on the last trading day of March. A fresh rally attempt abruptly ended in mid-May after tepid housing starts numbers seemed to confirm the previous day’s disappointingly poor read on homebuilder sentiment. Perhaps ironically, ITB jumped 3.7% in the wake of that report because an “in-line” Consumer Price Index (CPI) report kept rate cut hopes alive. ITB has sold off ever since despite an S&P 500 which has remained flat since then. This is the kind of underperformance I expect after the seasonal trade in homebuilders comes to an end.
")
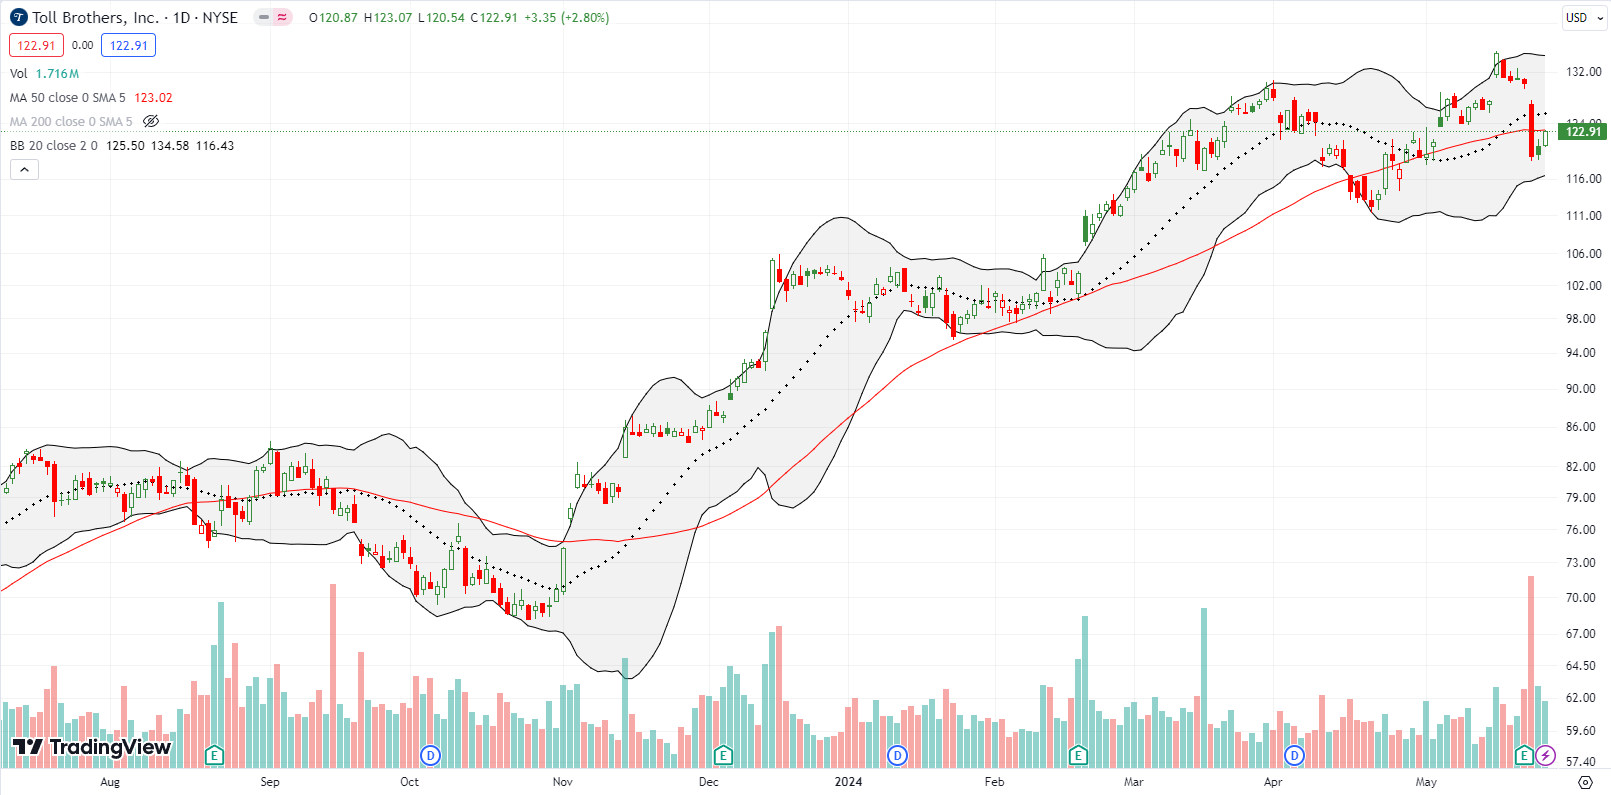
Toll Brothers, Inc (TOL) was the latest homebuilder to report earnings results. Investors greeted the news with an 8.5% pullback. That gap down left behind a definitive topping pattern for the stock. If not for the end of the seasonal trade on homebuilders, I would have bought into the discounted pricing. TOL’s headline results looked pretty good; the builder even increased its guidance for deliveries. However, it is also possible investors are reading the tea leaves of broadening weakness in the housing market.
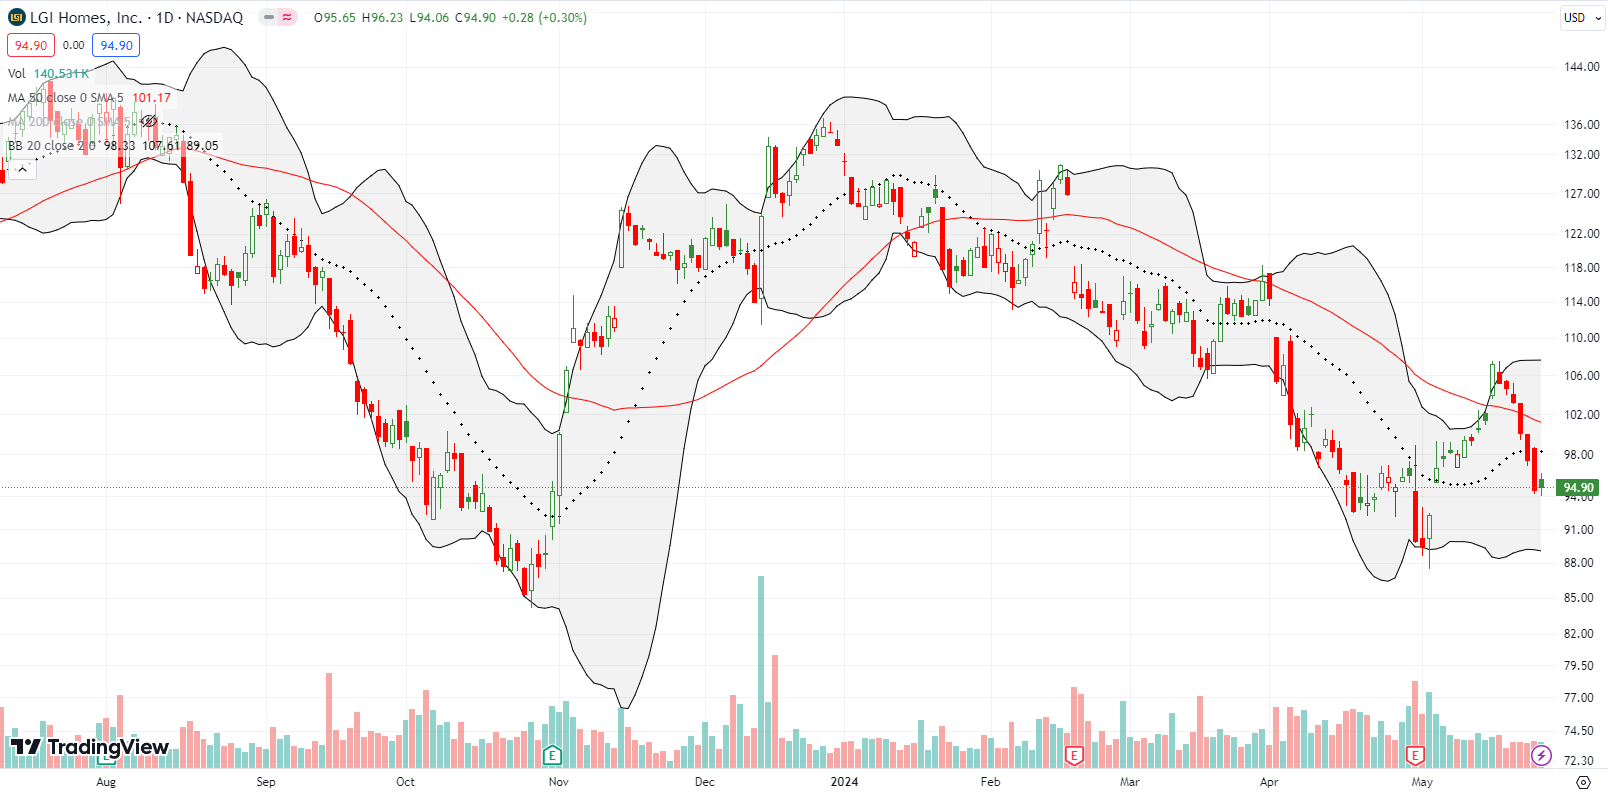
The South has under-performed this year and is a key driver of the broadening weakness in the housing market. LGI Homes, Inc (LGIH) seems to be suffering as a result with its concentration of Southern homes. LGIH is one of the worst performing builders in my universe. The stock is down 28.7% year-to-date versus ITB’s 3.0% gain year-to-date. A relief rally following the May earnings report is already near an end.
Housing Data
Home Builder Confidence: The Housing Market Index – May, 2024
Suddenly, builder confidence looks like it has topped out for now. Consistent with the topping theme from the last Housing Market Review, the May National Association of Home Builders (NAHB)/Wells Fargo Housing Market Index (HMI) plunged 6 points from April and landed back in negative territory (below 50). The HMI only spent two months in positive territory. According to the NAHB, the recent rebound in mortgage rates finally took its toll on potential buyers and higher long-term rates eroded builder confidence. The HMI component Single-Family: Next Six Months (Seasonally Adjusted) took the biggest relative hit and fell all the way to its lowest level of the year. Consumer confidence also fell sharply in May.
The NAHB complained that regulations are once again threatening to make housing more expensive: “For example, recent rules will require later this year that HUD and USDA insure mortgages for new single-family homes only if they are built to the 2021 International Energy Conservation Code.”
/Wells Fargo Housing Market Index (HMI) and the University of Michigan Index of Consumer Sentiment")
Source for data: NAHB and the University of Michigan
May featured a synchronized, sharp decline for consumer and builder sentiment.
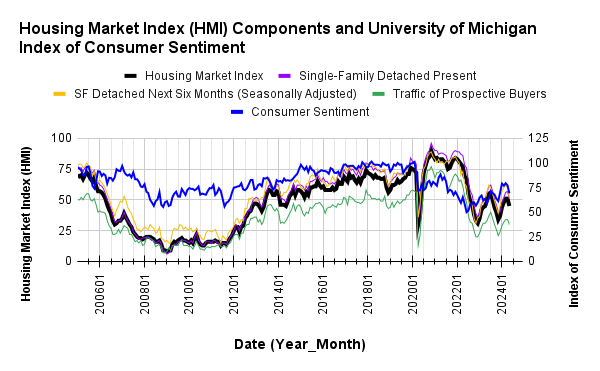
Pressure to reduce prices returned to the market. The 25% share of builders cutting prices is up from 22% in April and ends a 4-month downtrend. The average price discount stayed flat at 6% for the eleventh straight month. The share of builders providing incentives increased from 57% in April to 59% in May.
The HMI experienced broadening weakness across regions. The South was the one region to lose ground with its HMI in April. In May, it helped lead the plunge. The South’s HMI tumbled to it lowest point of the year as it lost 5 points to 45. The West also fell to its lowest point of the year with a steep plunge from 48 to 36. The West never pushed into positive territory for this latest cycle. The Northeast dropped from 65 to 58 and is now the only region with positive sentiment. The Midwest fell by just one point to 49.
New Residential Construction (Single-Family Housing Starts) – April, 2024
Single-family housing stayed flat near January’s levels. Unless the broadening weakness in the housing market deepens significantly, I will continue to assume that at worst starts are stabilizing around the 1M level. For April, single-family housing starts decreased 0.4% month-over-month to 1,031,000, down from 1,167,000 (revised downward from 1,167,000). Starts continued year-over-year strength with a 17.6% gain. Recall that the favorable comparables will continue until May.
![US. Bureau of the Census, Privately Owned Housing Starts: 1-Unit Structures [HOUST1F], first retrieved from FRED, Federal Reserve Bank of St. Louis, May 27, 2024](https://drduru.com/onetwentytwo/wp-content/uploads/2024/05/20240527_Housing-starts-April-2024.png "Housing starts")
Poor builder sentiment did not hinder intentions to build in 2023 and positive sentiment supported permit growth through February. However, building permits in March ended an impressive 13-month streak of sequential gains with a 4.7% decline from February. April’s permits declined 0.7% from March. These sequential declines align with a broadening weakness in the housing market. The year-over-year gain moderated for the third month in a row, from February’s 29.5% to 18.4% in March to 11.5% in April. These changes combined with flattening starts imply builders are close to the inventory levels they think they need to satisfy near-term demand. Plunging sentiment should also keep a lid on permits.
For the second month in a row, the Northeast was the only region which failed to achieve a large year-over-year jump in housing starts. The Northeast, Midwest, South, and West each changed -9.5%, +40.9%, +16.6%, and +18.4% respectively year-over-year.
New Residential Sales (Single-Family) – April, 2024
New home sales have essentially flat-lined this year. The spring selling season delivered no boost in sales and thus contributes to a broadening weakness in the market. April new home sales of 634,000 decreased 4.7% below March’s sales. March sales were revised downward from 693,000 to 665,000. Sales decreased 7.7% year-over-year; another sign of the broadening weakness in this year’s spring selling season. So much for my earlier expectation for new home sales to jump with the spring selling season.
![US. Bureau of the Census, New One Family Houses Sold: United States [HSN1F], first retrieved from FRED, Federal Reserve Bank of St. Louis, May 27, 2024.](https://drduru.com/onetwentytwo/wp-content/uploads/2024/05/20240527_New-Home-Sales-April-2024.png "new home sales")
The median price decreased slightly to $433,500, an increase of 3.9% year-over-year. The year-over-year changes look like they have bottomed.
A sharp shift in sales to homes priced near or above the median helped drive a sudden surge in price in March. In April, the sequential and year-over-year mix shifted toward the median. I am surprised by the notable swings in mix from month-to-month.
April’s inventory was 9.1 months of sales. This notable change from the 8.4, 8.3, 8.2, and 8.3 of previous months is yet one more sign of broadening weakness in the housing market. For comparison, a year ago inventory sat at just 7.6 months of sales. Absolute inventory in April increased from 477,00 to 483,000 or up 1.3%. On a month of sales basis, the new home market now seems over-supplied given 6 months of sales is considered a balanced market.
In November, the South stuck out as the one region with a year-over-year decline in sales. The same surprise occurred for February. For March, new home sales in the South jumped off recent lows with a 7.7% sequential gain, but in April the South’s sales fell back to the lows. Sales dropped 4.8% sequentially and a whopping 15.1% year-over-year. The South’s tepid sales dynamics add to the mosaic of broadening weakness in the housing market. For April, the West joined the South in dragging on national sales numbers. The Northeast, Midwest, South, and the West changed 0%, +27.5%, -15.1%, and -5.0% respectively.
Existing Home Sales – April, 2024
Hopefully existing home sales are still bottoming despite the broadening weakness in the housing market. The seasonally adjusted annualized sales in April of 4.14M declined 1.9% from March’s 4.22M (revised upward from 4.19M) while also decreasing 1.9% year-over-year. Like the market for new homes, the existing home sales market is not benefiting from the spring selling season (or things might be even worse without spring’s revival of interest!).

(For historical data from 1999 to 2014, click here. For historical data from 2014 to 2018, click here) Source for chart: National Association of Realtors, Existing Home Sales© [EXHOSLUSM495S], retrieved from FRED, Federal Reserve Bank of St. Louis, May 27, 2024

The weakness in the sales of condos and coops now looks like an early sign of the current broadening weakness in the housing market. These sales are languishing just above pandemic era lows. This warning sign still has not triggered commentary from the NAR. Perhaps a recovery for these sales requires a significant rebound in the share of first-time home buyers.
April’s absolute inventory of 1.21M homes was up 9% month-over-month and up 16.3% year-over-year. According to the NAR, “unsold inventory sits at a 3.5-month supply at the current sales pace, up from 3.2 months in March and 3.0 months in April 2023.” Given overall inventory remains extremely tight, I do not consider the big jump in inventory as a contributor to broadening weakness. Also, the NAR reported a (sudden?) surge in the inventory and sales of homes priced over $1M. The NAR did provide quantified context to the 34% increase in inventory and 40% in sales in this segment, but at least the dynamics match earlier claims from the NAR that inventory increases would lead to higher sales. The NAR did not provide specifics to explain what happened. I suspect California’s sales jump explain a large portion of the gains (see below).
The median sales price of an existing home continues to climb higher; perhaps April’s jump was driven by the surge in sales of homes priced over $1M. The median price increased 3.7% month-over-month, a third sequential gain in a row and a record for the month of April. An increase of 5.7% year-over-year created the 9th straight year-over year gain. The NAR expects these price gains to slow now that inventory is freeing up.
The average time on market for an existing home fell to 26 days, down from 33 days in March and 38 days in February. This average time was 22 days a year ago, so the seasonal press of buyers did show up but not as strongly as last year.
The share of sales to first-time home buyers soared back up from 26% in February to 32% in March and inched higher to 33% in April. The share was 29% a year ago. (Did first-time buyers clamor for the more expensive homes in April?). The NAR’s 2017 Profile of Home Buyers and Sellers reported an average of 34% for 2017, 33% for 2018, 33% for 2019, 31% for 2020, 34% for 2021, 26% for 2022, and 32% for 2023.
In January, the West was a surprising exception to the regional year-over-year declines in sales. All regions declined in February and March. The West was the sole gainer again in April; I suspect the surge in sales of homes priced over $1M occurred mostly in the expensive West. A surge in sales in California likely drove the bulk of the West’s gains (see the next section). The regional year-over-year changes were: Northeast -3.8%, Midwest -1.0%, South -5.0%, West -3.7%.
As usual, every region experienced a year-over-year price increase. The regional year-over-year price changes were again substantial for the Northeast: Northeast +8.5%, Midwest +6%, South +3.7%, West +9.3%.
Single-family existing home sales decreased 2.1% from March and declined on a yearly basis by 1.3%. The median price of $412,200 was up 5.6% year-over-year and up 3.9% month-over-month, the third sequential increase in a row.
California Existing Home Sales – April, 2024
California’s market for existing homes was a notable exception to the broadening weakness seen across the country. In fact, California experienced broad-based strength across regions. This twist is ironic given persistent stories about an exodus from the SF Bay Area, for example. Still, the numbers are so startling, I need to see a few more months of strength to believe it!
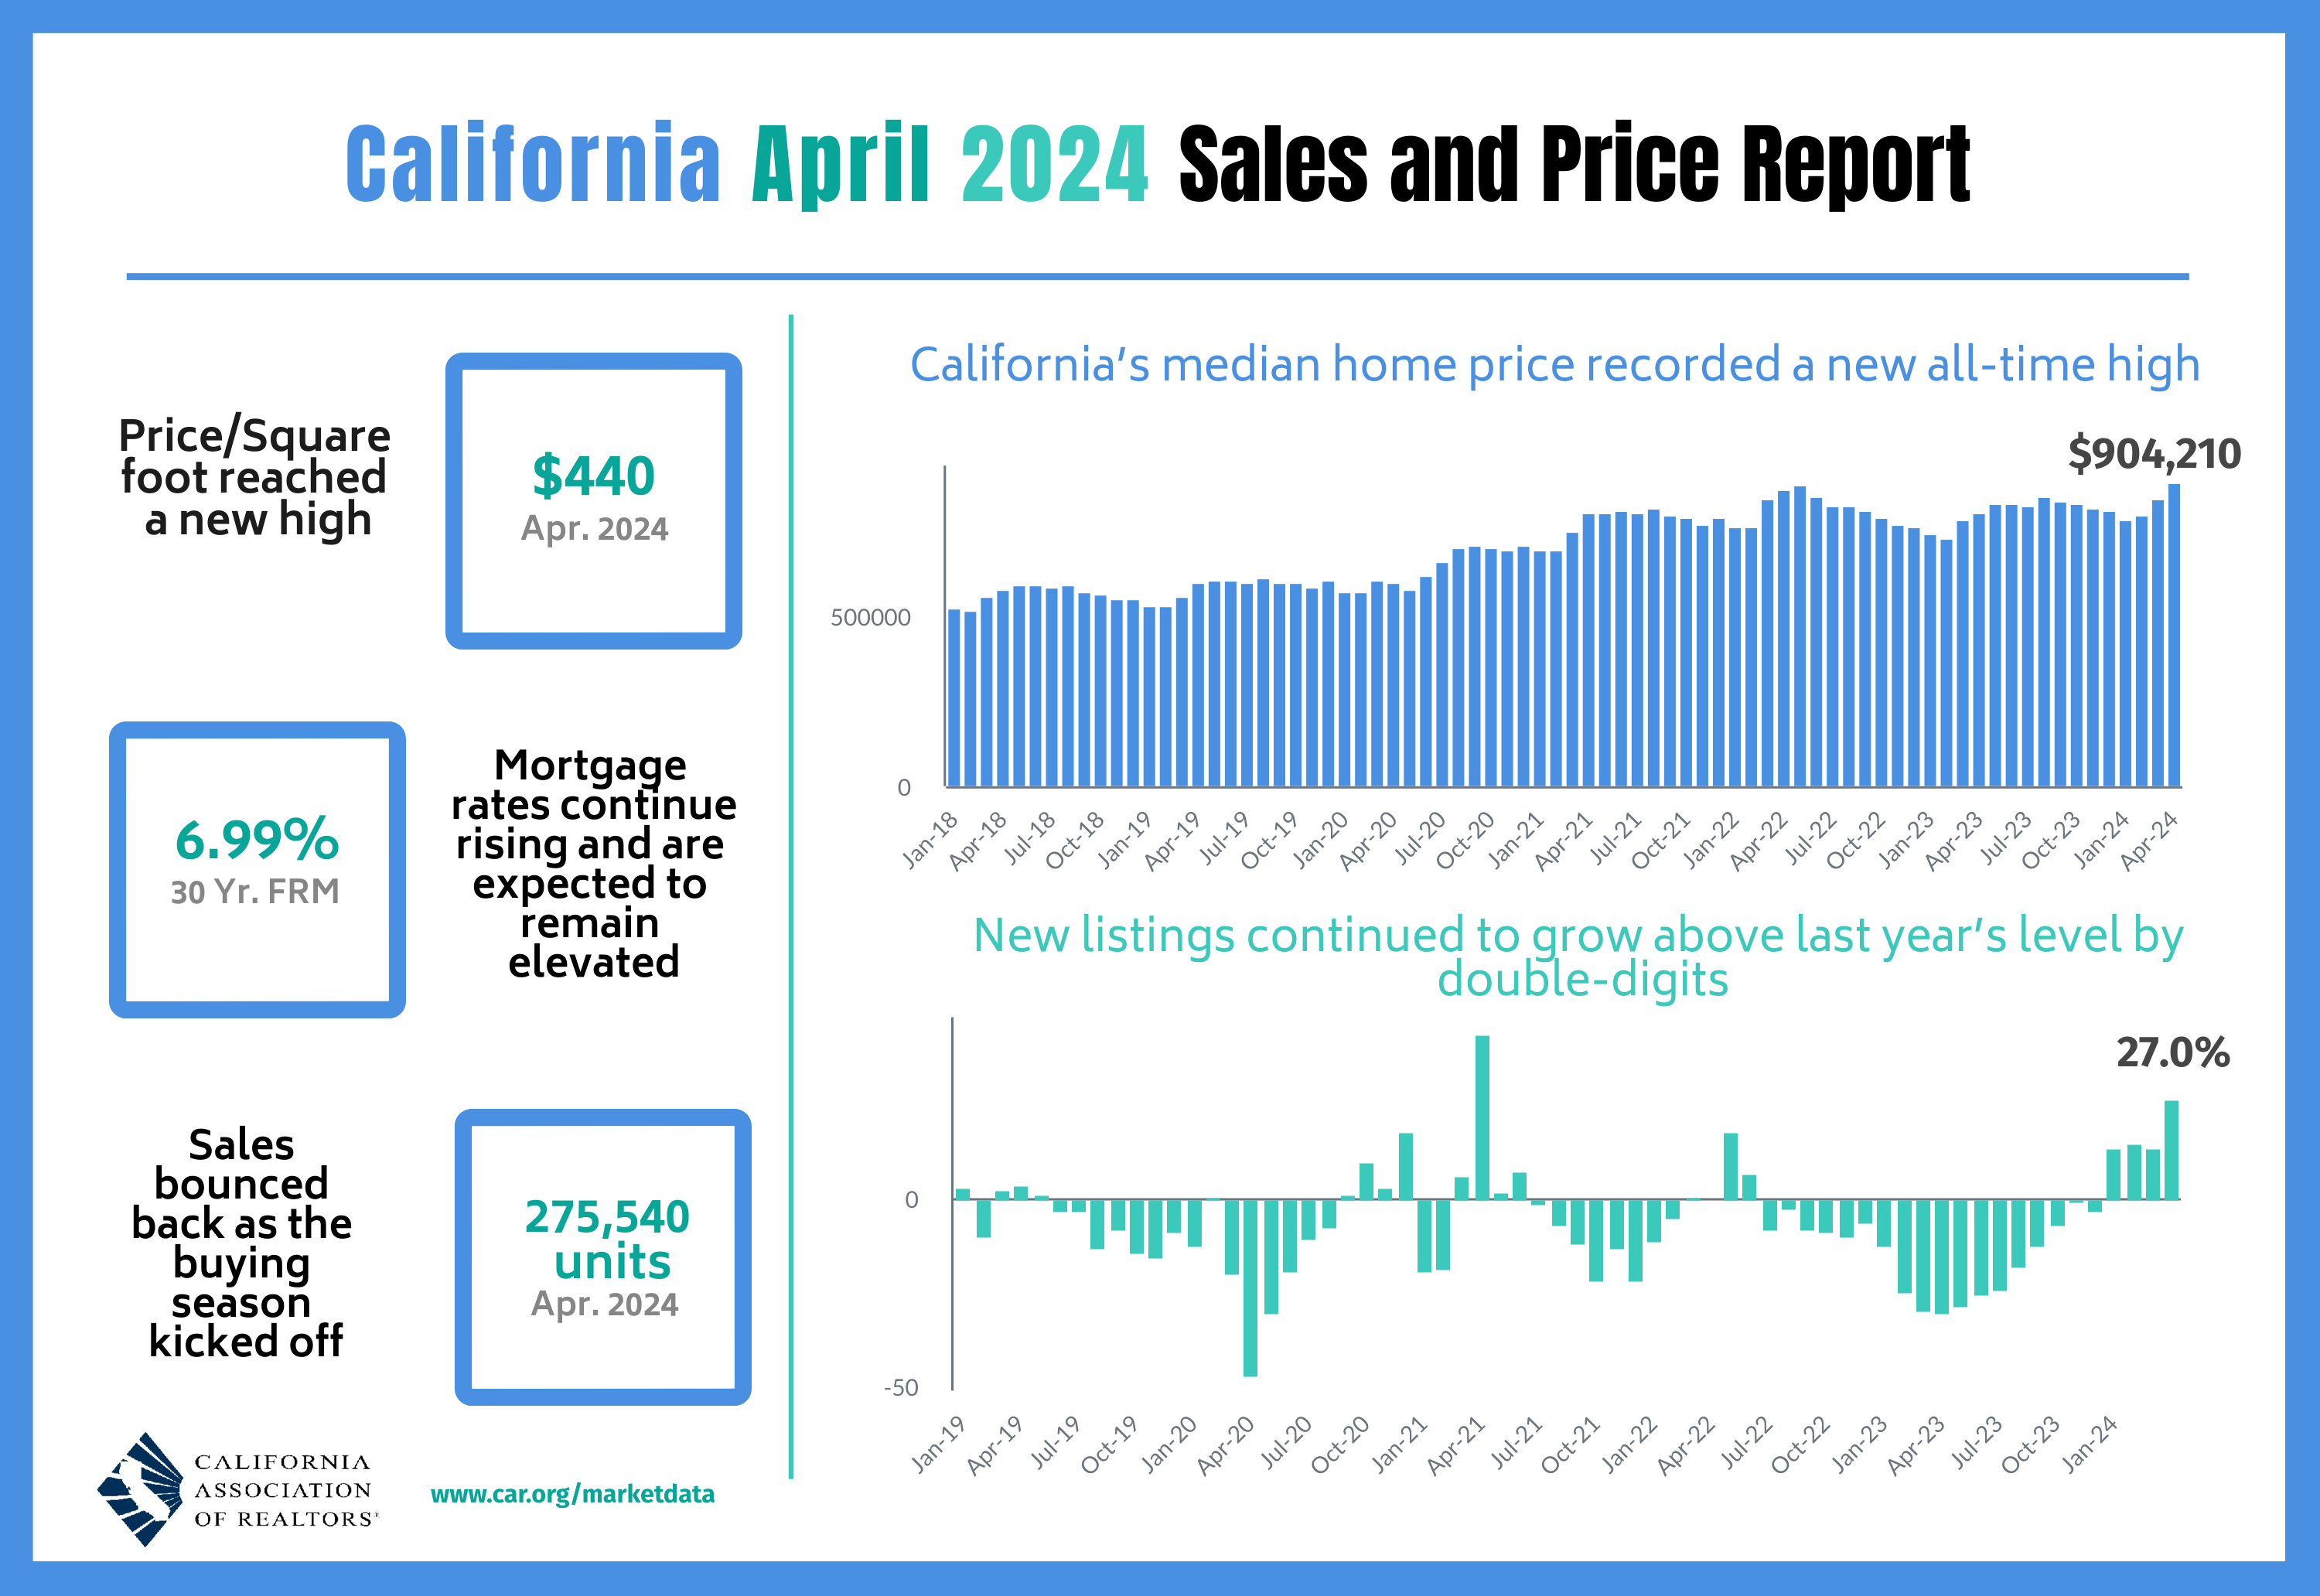
In March, California’s existing home market experienced a brief surge after 30 months of year-over-year declines, returning sales to September 2022 levels. However, the market showed signs of slowing down just as the spring selling season began. So the jump in April represents a sharp contrast. According to the latest report from the California Association of Realtors (C.A.R.), existing single-family home sales totaled 275,540 in April, marking a 3.0% increase from March and a 4.4% increase from April, 2023.
The gains in the median home price were even more startling. A year-over-year sales surge of 39.8% of homes priced over $1M created a widening market dichotomy and likely drove the jump reported nationally by the NAR. The median home price in April jumped to a new all-time high of $904,210, a gain of 5.8% from March and an 11.4% increase from the $854,490 median price in April, 2023. This ongoing rise, marking the tenth consecutive month of year-over-year gains, highlights the enduring strength in California’s higher-end market segments. Homes priced at or above $1 million increased sales by 9.9% in March while homes priced under $500,000 dropped in sales by 2.4% that month. Homes priced under $500,000 dropped in sales by 8.0% in April.
The median time it took to sell a home in California significantly declined yet again, this time from 19 days in March to 16 days in April. It took 20 days a year ago. This rapid turnover still significantly contrasts with the national numbers.
The statewide sales-price-to-list-price ratio was 100.0% for the third month in a row, unchanged from 100.0% in April 2023. The price per square foot for an existing single-family home in California was $440 in April, an 11.7% surge from the $394 a year ago. This increase paced the overall median price trends.
The Unsold Inventory Index (UII) remained flat at 2.6 months in April and essentially flat with the 2.5 a year ago.
Ironically, C.A.R. President Melanie Barker noted in the previous report that the Californian market lost momentum in March. C.A.R.’s Chief Economist Jordan Levine cautioned that further challenges may lay ahead with elevated mortgage rates. So far, California’s market has other ideas!
Home closing thoughts
New Cost Index Describes Severe Affordability Problems In Select Regions
The same folks who developed the Housing Market Index for home builder sentiment have launched the NAHB/Wells Fargo Cost of Housing Index (CHI). This quarterly index measures housing affordability by the percentage of income of the “typical family” in a given region must spend to buy the median-priced single family home. The CHI includes a national measure for new and existing homes and a metro-level for existing homes. I always wish these kinds of indices accounted for the number of income earners in a household.
Per the main page for the CHI, the index has a policy objective: “The CHI is a useful tool — especially for state and local home builders associations — to more easily convey to local authorities the burden that housing costs represent for middle-income and low-income families in their markets.” For example, the inaugural report laments that “In eight out of 176 markets in the first quarter, the typical family is severely cost-burdened (must pay more than 50% of their income on a median-priced existing home). In 80 other markets, such families are cost-burdened (need to pay between 31% and 50%).”
The CHI replaces the Housing Opportunity Index (HOI) as an easier to understand measure of housing costs.
Zombie Mortgages!
Zombie mortgages are a new concept for me and apparently also for a number of unsuspecting homeowners. Planet Money recently aired a broadcast about zombie mortgages. Homeowners are receiving foreclosure notices on second mortgages they assumed were no longer active. These loans often date back to the housing crisis of 2008. This dormancy led homeowners to believe the loans were discharged. However, where the law allows, lenders can revive these debts if they think the home has sufficient equity to go after it. The article shares stories of affected homeowners who are struggling to deal with the surprise foreclosure notices. Some homeowners are fighting back legally, while others are seeking financial advice to manage the unexpected debt.
U.S. Economic Outlook and Housing Price Dynamics
Federal Reserve Vice Chair Philip N. Jefferson spoke at the Mortgage Bankers Association’s Secondary and Capital Markets Conference and Expo 2024 in New York, New York on May 20th in a speech titled “U.S. Economic Outlook and Housing Price Dynamics.” The speech emphasized the need for a long-term perspective on housing market dynamics. Sustainable housing market growth requires addressing supply constraints, ensuring affordability, and maintaining financial stability. The Federal Reserve of course only directly influences the stability part of this equation. Jefferson noted that government policies support housing affordability and supply, including measures like zoning reforms, incentives for new construction, and support for affordable housing initiatives. So, Jefferson did not break new ground with this speech, but I found this subject interesting in the context of a Federal Reserve that continues to battle stubborn inflation with high rates meant to cool off a (formerly) red hot housing market.
Spotlight on Mortgage Rates
The Mortgage Bankers Association (MBA) reported three weekly increases and one weekly decrease in mortgage applications in May. A slight cooling in mortgage rates in May likely helped drive the overall gains. However, in April, new home mortgage purchase applications surged 22.1% year-over-year despite a steady rise in mortgage rates. Applications gained 2% month-over-month (not seasonally adjusted). This strength follows 6.1%, 15.7% and 19.1% year-over-year surges in March, February, and January respectively. The year-over-year increase was the 15th consecutive month of gains and contrasts with the other indicators I claim demonstrate a broadening weakness in the housing market. New home sales in particular were down year-over-year in April after three months of tepid gains (are cash buyers responsible for the weakness?).
The MBA even had bullish commentary about April’s results: “There continues to be healthy demand for new homes, given greater availability and other benefits over existing home purchases such as builder concessions and customization options. First-time homebuyers account for a growing share of purchase applications with the FHA share of applications at 26.3 percent in April, higher than the survey average of 18 percent dating back to 2013.” Needless to say, I am eager to see the report for May’s mortgage purchase applications.
![Freddie Mac, 30-Year Fixed Rate Mortgage Average in the United States [MORTGAGE30US], retrieved from FRED, Federal Reserve Bank of St. Louis; May 27, 2024.](https://drduru.com/onetwentytwo/wp-content/uploads/2024/05/20240527_30-Year-Fixed-Rate-Mortgage-Average-in-the-United-States.png)
Be careful out there!
Full disclosure: long ITB shares and call spread
Photo credit?
Me. 🙂
At UC Davis. One of the “eggheads” around campus.
Yes, and I love it – but who took it? Or did you prop up a camera and use a timer?
Ah! My son took the picture. The kid and I were on a college tour of UC Davis.