
This year has been a surprisingly good year for speculating. The race to the end of 2023 looked like it priced in a lot of good news, but the good news (in price action) continues apace year-to-date. Thus, I decided to take a fresh look at last year’s claim: “Renaissance IPO ETF A Less Volatile Way to Speculate Than ARKK“. Interestingly, the rally since that post has advantaged the Renaissance IPO ETF (IPO) so much so that IPO now essentially looks overall better than the ARK Innovation ETF (ARKK). Given this development, I added to the mix the Invesco QQQ Trust (QQQ), the ETF of big cap technology stocks. ARK’s Cathie Wood regularly scoffs at many of the companies in QQQ as the sluggards who will get slayed by her army of disruptors. So far, maturity continues to win the long race!
The following table shows the price performance of the three ETFs using the closing price downloaded from Yahoo Finance. The links below provide the data files. I used the Data Analyst in ChatGPT to quickly generate this table with the data (and yes, I did some manual checks. I even asked ChatGPT to show its work in detail. See the appendix below for this self-validation). QQQ is the hands-down winner across all timeframes. Meanwhile, IPO beats out ARKK in all but the longest timeframe; good luck in being smart enough to load up in 2016. Perhaps most importantly, this year IPO is not just a way to lose less than ARKK when speculating falls out of favor, IPO is doing well enough to keep pace with QQQ.
| Time Frame | ARKK (%) | IPO (%) | QQQ (%) |
|---|---|---|---|
| Since 2016 | 148.0 | 93.3 | 292.5 |
| Since 2020 | 1.4 | 29.8 | 106.5 |
| Since 2021 | -59.2 | -37.4 | 39.9 |
| Since 2022 | -46.3 | -30.2 | 10.3 |
| Since 2023 | 62.5 | 63.3 | 64.9 |
| Year-to-date | -3.1 | 7.1 | 7.2 |
Big Cap Tech Plowed Through the Bubble In Innovation
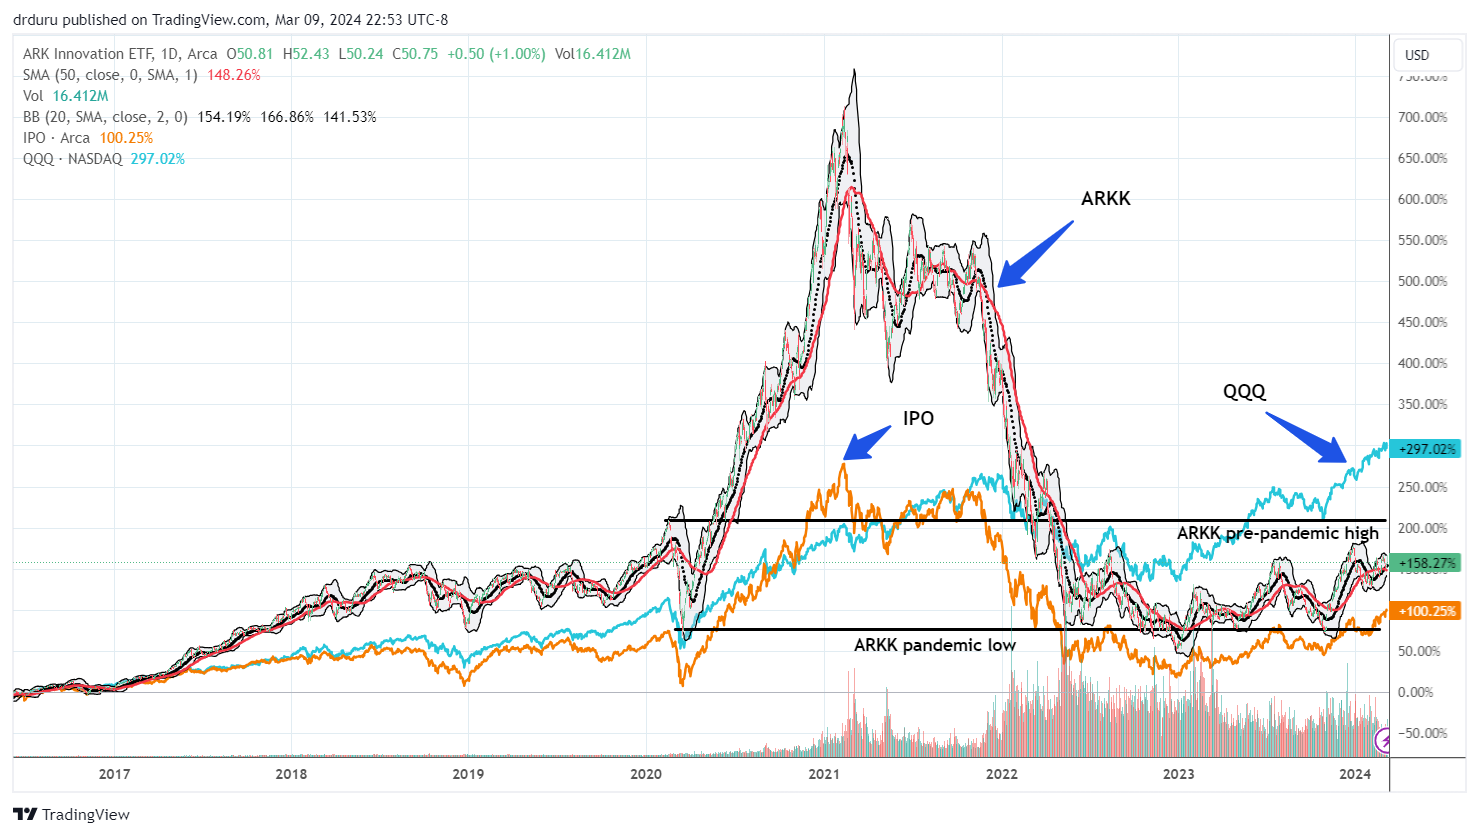
I find the chart below quite instructive. It provides a visual on the price dynamics since 2016 between ARKK, IPO, and QQQ. Note the massive bubble in ARKK that leaves ARKK far from recovery. IPO is also nowhere near a recovery, but its bubble was also less severe than ARKK. While ARKK has yet to rebound to its pre-pandemic high, IPO accomplished this feat in 2022 and at every subsequent high since then.
Meanwhile, QQQ, the “old fogey” of innovation and cabal of tech giants, just chugged along. QQQ avoided the dreaded B-word by ending its correction far above the pandemic-driven collapse in March and April, 2020. Moreover, QQQ now enjoys new all-time highs. Neither ARK nor IPO can even begin to dream of such a feat anytime soon.
The Upshot
Once the IPO market wakes up again, IPO could further outpace ARKK. ARKK could be slow to create a significant weighting in the newest sparkles for speculating while IPO summarily discards the old for the new. Renaissance keeps the newest stocks in the IPO ETF; the current average age of an IPO stock is 2.2 years at the time of writing. Meanwhile, ARKK promises to invest in disruptive innovation and companies that benefit from that innovation.
Appendix: ChatGPT Shows Its Work
See below for how ChatGPT responded when I asked “Now show your work in detail…including example numbers that describe your methodology.”
To illustrate the detailed methodology with example numbers, let’s focus on calculating the “since 2023” performance for the QQQ ETF using the closing price. This example will include identifying the last trading day of 2022 to use its closing price as the starting value and then comparing it to the most recent closing price available in the dataset.
Steps for the Calculation:
- Identify the Last Trading Day of the Previous Year (2022):
- This involves finding the maximum date in the dataset that is less than or equal to December 31, 2022, which represents the last trading day of 2022.
- Find the Closing Price on the Last Trading Day of 2022:
- This price serves as the starting point for our “since 2023” calculation.
- Identify the Most Recent Trading Date in the Dataset:
- This date provides the end point for our calculation.
- Find the Closing Price on the Most Recent Trading Date:
- This price is compared to the starting price to calculate the performance.
- Calculate the Percentage Change:
- The formula used is (End Price−Start PriceStart Price)×100%(Start PriceEnd Price−Start Price)×100%.
Let’s extract the specific dates and closing prices for these steps regarding the QQQ ETF’s “since 2023” performance.
For the “since 2023” performance calculation of QQQ using the closing price, here are the specific details and numbers:
- Last Trading Day of 2022: December 30, 2022
- Starting Closing Price (Last Trading Day of 2022): $266.28
- Most Recent Trading Date in the Dataset: March 8, 2024
- Ending Closing Price (Most Recent Trading Date): $439.02
With these numbers, the percentage change calculation is:
Percentage Change=((439.02−266.28)/266.28)×100% {edited for formatting}
This calculation will show the growth in the closing price of QQQ from the end of 2022 to the most recent trading date in 2024. Let’s perform this calculation for the exact percentage change.
The calculated percentage change for QQQ since 2023, based on the closing price and starting from the last trading day of 2022, rounded to one decimal point, is 64.9%. This demonstrates a significant increase in the closing price of QQQ from the end of 2022 to the most recent data point in early 2024, highlighting the ETF’s performance over this period using the specified methodology.
Be careful out there!
Full disclosure: long ARKK and short ARKK call, long IPO, long QQQ call spread