

Stock Market Commentary:
The stock market oozed with bullish intent as it pushed its way through the latest Federal Reserve statement on monetary policy. While Jerome Powell made sure to stick to the script and introduced no surprises to the market, he was surprisingly reluctant to underline the Fed’s hawkishness. The market made a mile out of an inch and put on an impressive display. Market breadth widened further, the major indices reached new milestones, and the volatility index plunged deeply into bullish territory. The current momentum supports an extended overbought period.
Powell tried to assert some caution in the markets. He acknowledged his relief in the current disinflationary trends, but he also warned that over 50% of the PCE (personal consumption expenditure) is not participating in that trend. Core services, excluding housing, has not yet started a descent. Yet, when asked about easing financial conditions, Powell did not take the opportunity to push back hard. Instead, he chose to point to the longer path of tightening conditions and did not address the current downtrend. The scolding was tepid, and the stock market ran right through it with bullish intent.
The Stock Market Indices
The S&P 500 (SPY) is suddenly at a 5-month high and tantalizingly close to finishing its reversal of losses that started with Jackson Hole last August. The index gained 1.1%, For the first time since Jackson Hole, it confirmed a breakout above the May, 2021 low. Current bullish intent points to an eventual challenge of last August’s high.
")
The NASDAQ is still playing technical catch-up to the S&P 500. However, today’s 2.0% gain created a very important confirmation of a breakout above its 200-day moving average (DMA) (the blue line). The tech-laden index is at a 5-month high and within inches of challenging resistance from its September, 2020 high. I used the surge to take profits on weekly QQQ call options I bought in Monday’s small dip. I guessed that a follow-through of the 200DMA breakout was imminent. My old QQQ February put spread is essentially dead at this point.
")
The iShares Russell 2000 ETF (IWM) has shown the most bullish intent year-to-date. A 1.6% gain punched the ETF of small caps above its bear market line. Suddenly, the NASDAQ is the lone index still in bear market territory.
")
Stock Market Volatility
At the end of last week, the volatility index (VIX) “did not quite cooperate with the market’s bullish anticipation.” Today, bullish intent sent the VIX convincingly plunging to a 52-week low. Monday’s gap up in the VIX voided my plan to go into the Fed meeting with fresh put options. The pop looked like a bear trap, and I happened to get this one right. Note how the VIX stopped cold right at its 20DMA (the dotted line). The VIX once again confirmed its overall downtrend off the October peak.
")
The Short-Term Trading Call With Bullish Intent
- AT50 (MMFI) = 79.2% of stocks are trading above their respective 50-day moving averages (overbought day #8 and near 52-week high)
- AT200 (MMTH) = 62.6% of stocks are trading above their respective 200-day moving averages
- Short-term Trading Call: neutral
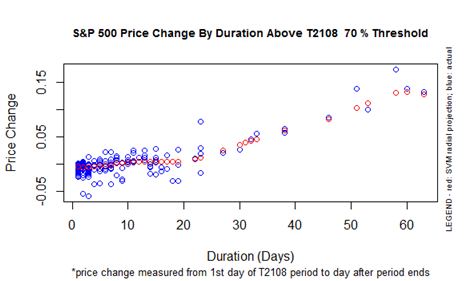
AT50 (MMFI), the percentage of stocks trading above their respective 50DMAs, closed at 79.2%. At 8 straight trading days overbought, my favorite technical indicator is in extended overbought territory (recall that the last such run was in late 2020). This move well reflects the market’s apparent bullish intent. The S&P 500 is now up 2.5% since overbought trading conditions began. The old chart below of T2108, the percentage of stocks trading above their respective 40DMAs, is a reminder of the potential gains in an extended overbought period. (I will update these analyses with AT50 at some point soon).
As planned, I am keeping the short-term trading call at neutral for the duration of this overbought period. Even though the market oozes with bullish intent, I almost never flip bullish during overbought periods. I might consider such a flip on a test of key support after the overbought period ends. If support is far enough away, I will actually flip bearish. This is truly a fine needle to thread!
AT200 (MMTH), the percentage of stocks trading above their respective 200DMAs, is leading the charge of bullish intent. This indicator of longer-term sentiment continues its impressive breakout. AT200 closed the day at an 18-month high. An amazing 62.6% of stocks now trade above their 200DMAs. This level means that traders are scanning a landscape full of bullish breakouts. This kind of picture can feed on itself and feed more and more bullish intent.
")
")
Be careful out there!
Footnotes
“Above the 50” (AT50) uses the percentage of stocks trading above their respective 50-day moving averages (DMAs) to measure breadth in the stock market. Breadth defines the distribution of participation in a rally or sell-off. As a result, AT50 identifies extremes in market sentiment that are likely to reverse. Above the 50 is my alternative name for “MMFI” which is a symbol TradingView.com and other chart vendors use for this breadth indicator. Learn more about AT50 on my Market Breadth Resource Page. AT200, or MMTH, measures the percentage of stocks trading above their respective 200DMAs.
Active AT50 (MMFI) periods: Day #75 over 20%, Day #71 over 30%, Day #20 over 40%, Day #18 over 50%, Day #15 over 60%, Day #8 over 70% (overbought)
Source for charts unless otherwise noted: TradingView.com
Full disclosure: long QQQ put spread
FOLLOW Dr. Duru’s commentary on financial markets via StockTwits, Twitter, and even Instagram!
*Charting notes: Stock prices are not adjusted for dividends. Candlestick charts use hollow bodies: open candles indicate a close higher than the open, filled candles indicate an open higher than the close.