Stock Market Commentary:
The holiday-shortened week brought a reluctant return to overbought trading conditions. Buyers nudged the indices higher inch by inch after Monday’s slightly down open. The Fed-speak that returned the stock market to bearish trading conditions faded out of view. Looking ahead, the promise of seasonal strength once again beckons reluctant buyers. If sellers prove even more reluctant than the buyers, the market’s path of least resistance will of course be higher. A sudden reversal from current levels will reconfirm bearish trading conditions with a fresh drop from overbought territory. Either way, this is not a market for making sudden moves.
The Stock Market Indices
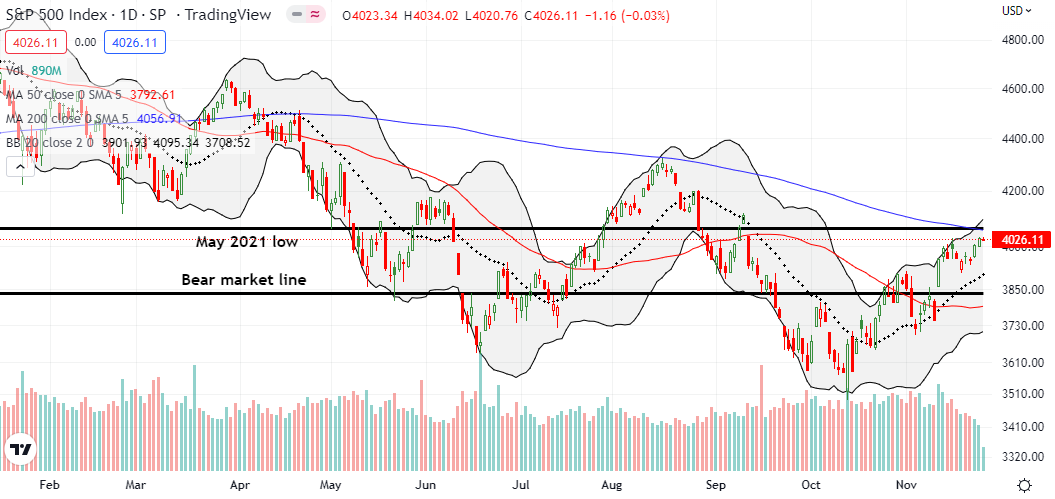
The S&P 500 (SPY) drifted higher last week. A fresh test of overhead resistance at the 200-day moving average (DMA) (blue line below) remains elusive. The index closed at a 2-month high with reluctant overbought trading conditions hanging in the balance. Another fade from here could be more ominous than August’s failed test of 200DMA resistance given the move would represent a lower high and a failure near the September high.
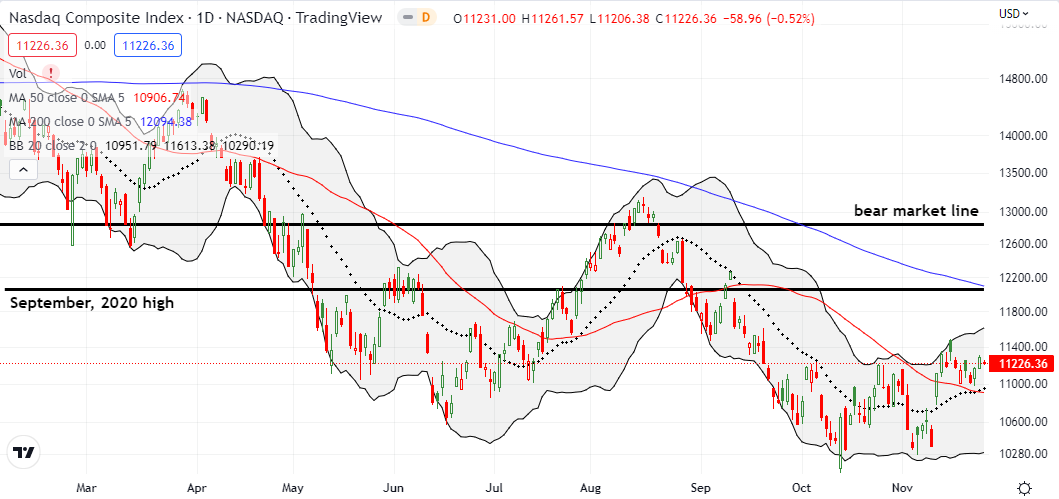
The NASDAQ (COMPQ) remains far away from a critical test of 200DMA resistance. Instead, the tech-laden index is still stuck churning away above 50DMA support (the red line below). The upshot of these conditions comes from the significant potential upside for a NASDAQ getting over the reluctant overbought trading conditions.
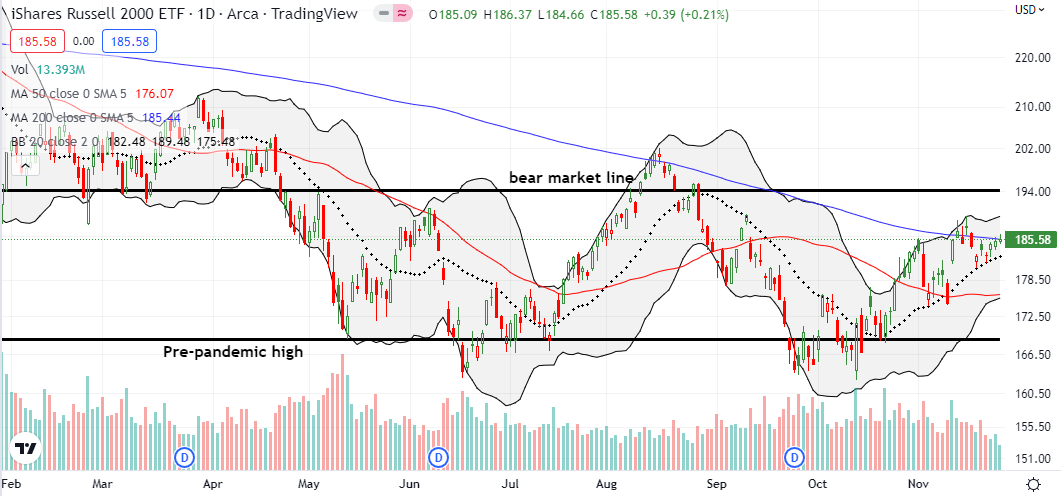
The iShares Russell 2000 ETF (IWM) met reluctant overbought trading conditions with an ever so tentative test of 200DMA resistance. If not for the successful tests of 20DMA support (the dashed line below), I would automatically assume IWM will soon fail this test. IWM’s upside from a breakthrough could easily take the ETF of small caps right back to the bear market line (20% down from the all-time high). A fresh sell-off could easily find fresh support at the 50DMA.
Stock Market Volatility
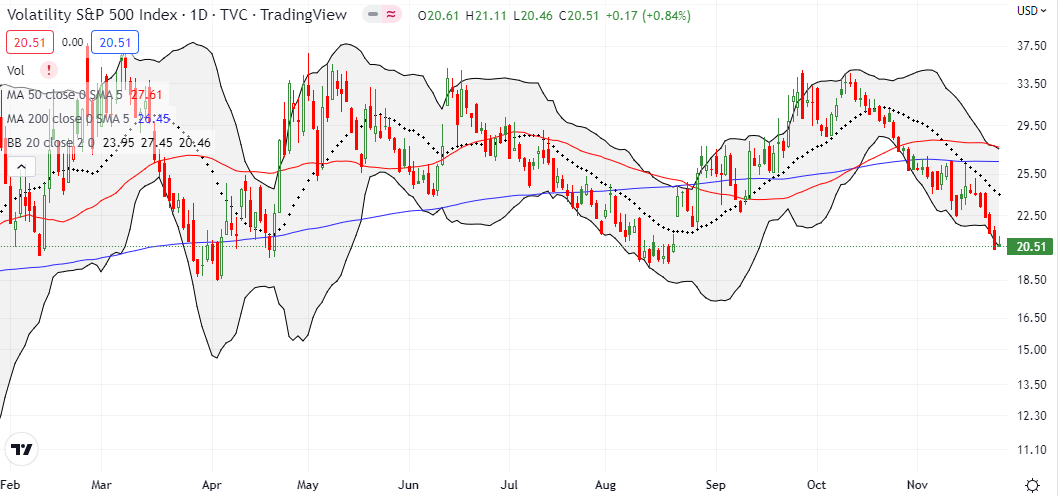
The volatility index (VIX) exited its churn from the previous week and made a beeline for the critical 20 level that marks “elevated” volatility. The VIX showed little reluctance last week! Friday’s holiday shortened trading offered a brief moment of uplift for the VIX before faders stomped out the flicker. Follow-through declines from here set up the bulls for a good start to December. Traders need to closely monitor the August lows around 19.5 and next the March lows around 18.5.
The Short-Term Trading Call With A Reluctant Return to Overbought
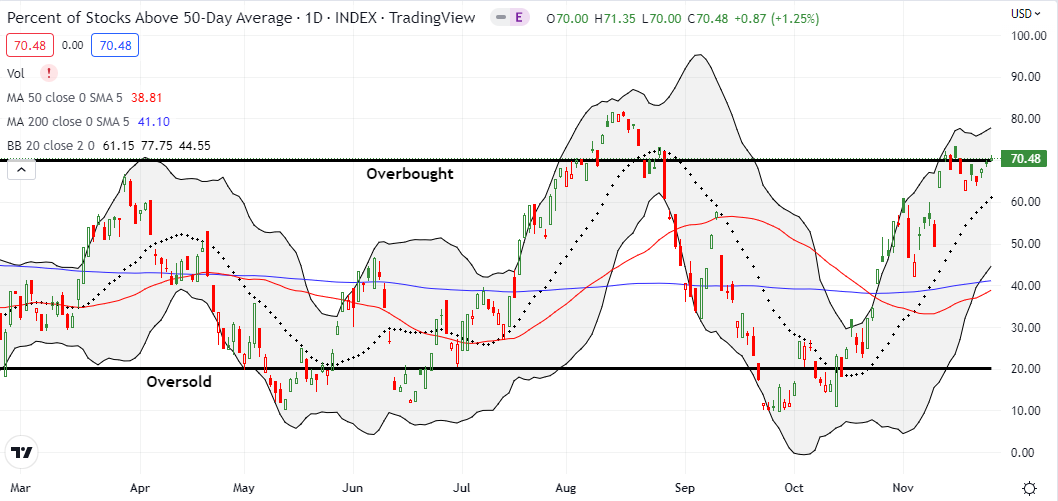
- AT50 (MMFI) = 70.5% of stocks are trading above their respective 50-day moving averages (overbought day #1)
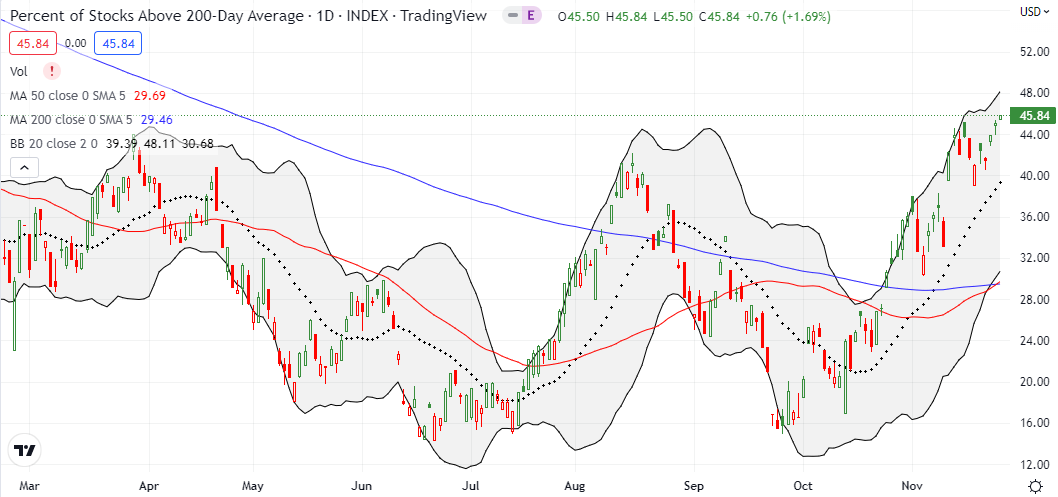
- AT200 (MMTH) = 45.8% of stocks are trading above their respective 200-day moving averages (new 10=month high)
- Short-term Trading Call: cautiously bearish
AT50 (MMFI), the percentage of stocks trading above their respective 50DMAs, looked reluctant to return to overbought trading conditions. My favorite indicator dropped slightly on Monday and then gained one to two percentage points a day on its way to closing the week a fraction above the 70% overbought threshold. After I downgraded my short-term trading call to cautiously bearish, the stock market did not provide a good entry point for bearish positions. I am even still holding on to aging calls from my bullish period. However, I am on alert for an opportunity to fade after AT50 next closes below the 70% threshold.
Of course, the challenge for bears here is that a reluctant stock market just needs one or two more nudges to the upside to open seasonal spigots to the upside. AT200 (MMTH), the percentage of stocks trading above their respective 200DMAs, declared the most bullish signal with levels last seen at the beginning of the year. In other words, a growing number of stocks have been turning around since the September lows and providing bullish hope with sustained 200DMA breakouts. Of the major indices, the S&P 500 and IWM are best positioned to catch-up and vindicate bulls. Such a vindication would push my short-term trading call back to neutral; if I am bullish during overbought trading it is only because I managed to stay bullish going into the period.
This time around, I reluctantly retreated from the earlier bullish call, but I chose adherence to the trading rules over exercising discretion.
Be careful out there!
Footnotes
“Above the 50” (AT50) uses the percentage of stocks trading above their respective 50-day moving averages (DMAs) to measure breadth in the stock market. Breadth defines the distribution of participation in a rally or sell-off. As a result, AT50 identifies extremes in market sentiment that are likely to reverse. Above the 50 is my alternative name for “MMFI” which is a symbol TradingView.com and other chart vendors use for this breadth indicator. Learn more about AT50 on my Market Breadth Resource Page. AT200, or MMTH, measures the percentage of stocks trading above their respective 200DMAs.
Active AT50 (MMFI) periods: Day #29 over 20%, Day #25 over 30%, Day #23 over 40%, Day #11 over 50%, Day #11 over 60%, Day #1 over 70% (overbought day #1 ending 6 days under 70%)
Source for charts unless otherwise noted: TradingView.com
Full disclosure: long IWM calendar call spread, short IWM put spread, long SPY calendar call spread
FOLLOW Dr. Duru’s commentary on financial markets via StockTwits, Twitter, and even Instagram!
*Charting notes: Stock prices are not adjusted for dividends. Candlestick charts use hollow bodies: open candles indicate a close higher than the open, filled candles indicate an open higher than the close.


