Stock Market Commentary:
A month ago, a CPI Shocker brought a bear market rally to an abrupt end and created an historically bad September. Today’s CPI Shocker, another inflation reading that came in hotter than expected (imagine that), generated a completely different, and bullish, response. The stock market gapped down at the open and buyers took over from there. After the dust settled, oversold trading conditions ended on the heels of an epic bullish engulfing technical pattern.
The Stock Market Indices
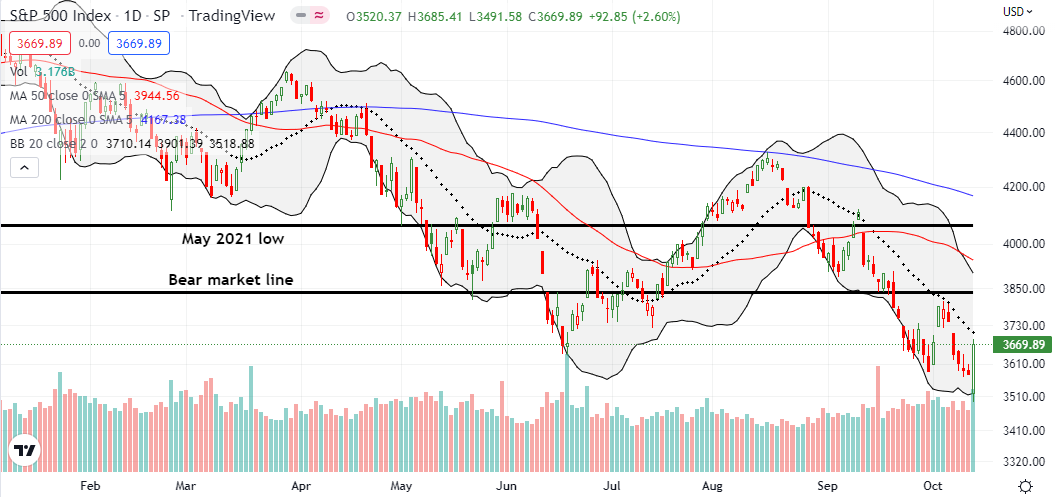
The S&P 500 (SPY) reacted to the hot CPI report with a 1.6% gap down at the open. Buyers took over the trading action and nearly closed out the index right at resistance from its 20-day moving average (DMA) (dotted line below). The resulting bullish engulfing pattern carved out a deep bottom at the end of a downtrend with the low of the day far below the low of the previous day and the high of the day far above the high of the previous day. Note that resistance at the 20DMA has held firm for two months, so the index once again faces a critical test. A breakout would put the S&P 500 on a fresh collision course with its bear market line.
I used the rally to cover a short SPY put option. I am still holding a short SPY put spread expiring next week.
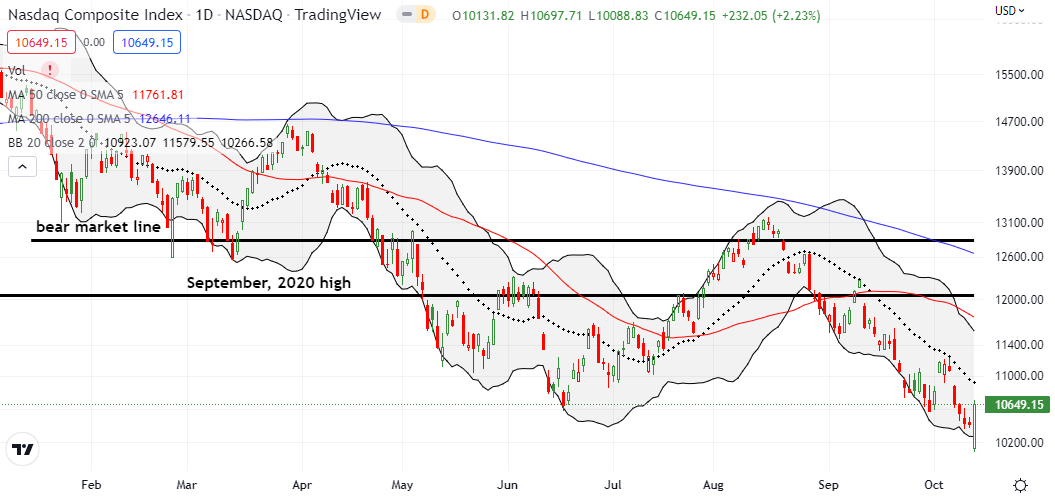
The NASDAQ (COMPQ) closed far short of its 20DMA resistance. Its bullish engulfing pattern started with a deep 2.7% gap down that stopped just short of NASDAQ 10K and ended with a 2.2% gain on the day. I used the open to take profits on my QQQ put spread expiring next week. Amazed that the tech-laden index managed to get back to flat, I jumped into a QQQ $255 calendar put spread with the short side expiring on Friday. I fully expected the short side to exit the week worthless and leave behind a decent hedge for next week’s trading. Like the S&P 500, the NASDAQ is still in the middle of a persistent downtrend defined by its 20DMA.
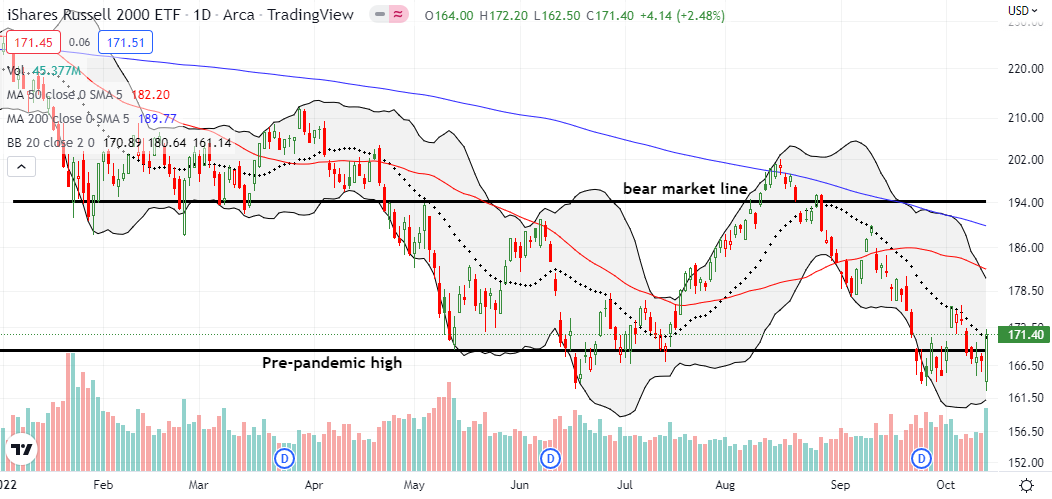
The iShares Russell 2000 ETF (IWM) closed the day at 20DMA resistance and started with a fresh test of its June low. The pre-pandemic high acted as a pivot for the resulting bullish engulfing bottoming pattern. I continue to hold my bullish IWM call positions (expiring next Friday).
Stock Market Volatility
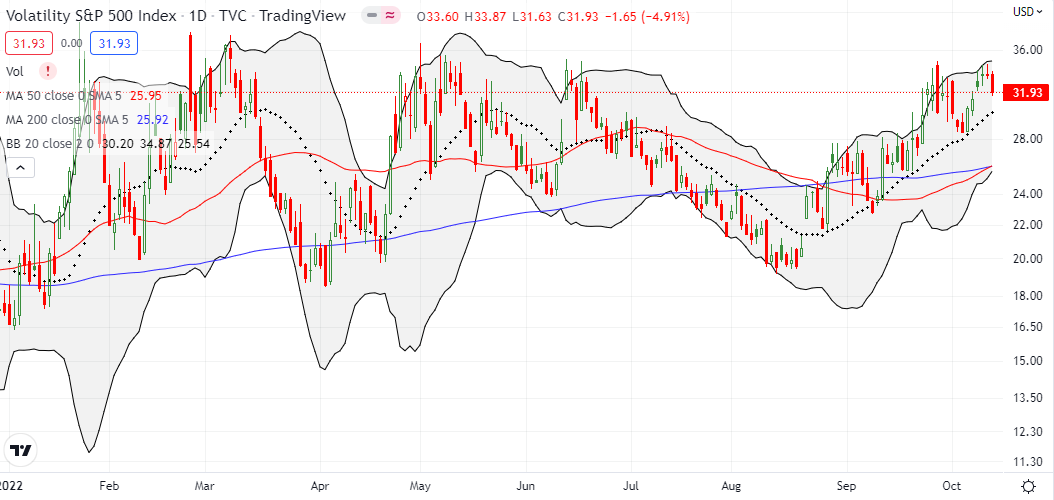
The volatility index (VIX) continues its strange behavior. When the stock market gapped down, the VIX opened essentially flat. The lack of a VIX surge stalled my plans to implement the AT50 trading rules and aggressively buy into the selling. The VIX “should” have made new highs. Given the market’s sharp rebound, I am also surprised the VIX did not lose more than it did. The 4.9% loss did not even test the VIX’s uptrend (see the dotted line below). This behavior suggests that the stock market is at risk for an immediate setback before it can confirm the bullish engulfing patterns across the tradescape.
The Short-Term Trading Call With A Bullish Engulfing
- AT50 (MMFI) = 23.2% of stocks are trading above their respective 50-day moving averages
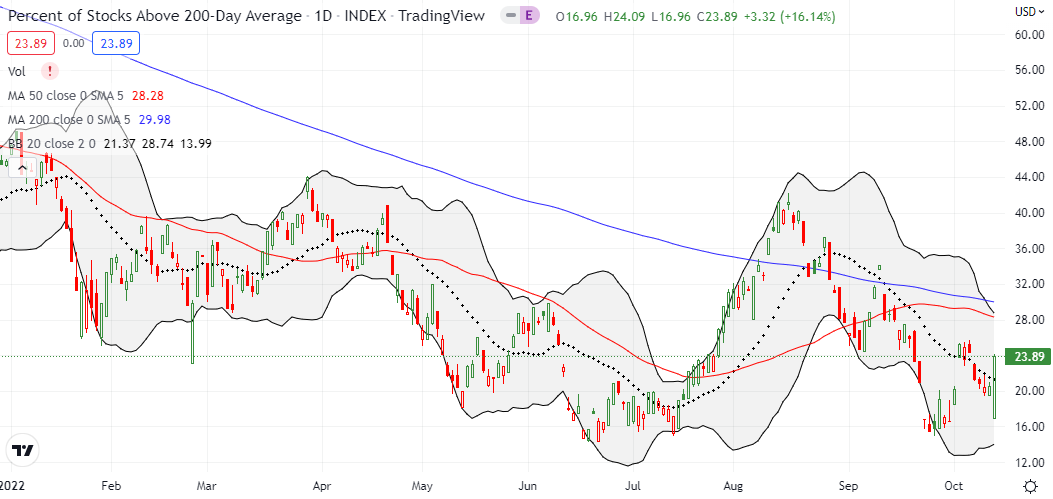
- AT200 (MMTH) = 23.9% of stocks are trading above their respective 200-day moving averages
- Short-term Trading Call: bullish
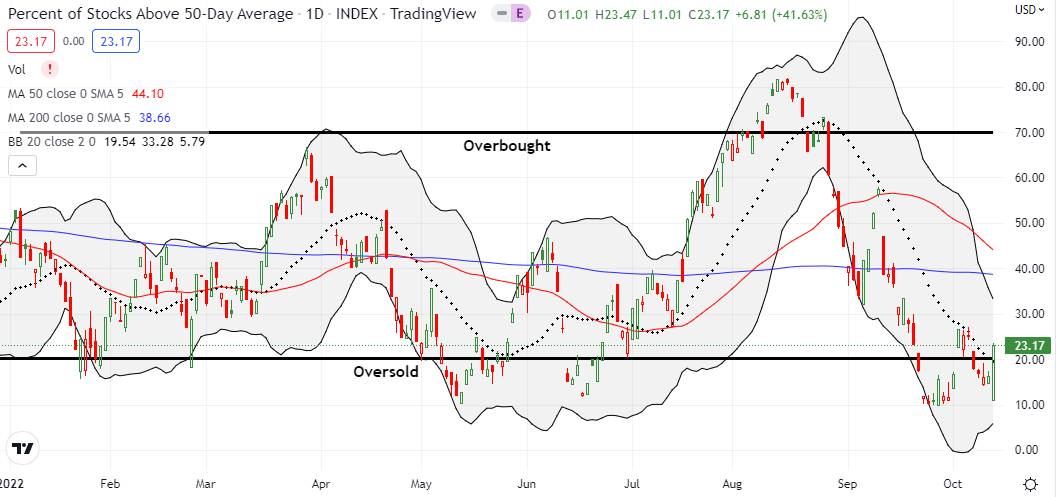
AT50 (MMFI), the percentage of stocks trading above their respective 50DMAs, leapt out of oversold territory thanks to the bullish engulfing patterns. My favorite technical indicator hit 11.0% at its low and closed at 23.2%. AT50 even made a higher low than the last oversold period. With earnings season about to start with indices pressing their bets against downtrending 20DMA resistance, I feel a bit queasy over further upgrading my short-term trading call from cautiously bullish to bullish. However, the AT50 trading rules suggest I do so. The bullish engulfing pattern makes the decision easier. Moreover, October is historically a month for buying into sell-offs. A quick return to oversold territory would drop me back to cautiously bullish given I would brace for the potential invalidation of the bottoming signal.
The sharp moves of the day pushed me into active mode. I scrambled to take profits on existing short positions, take profits on a few bullish positions, and jump into some light hedges to lean against the bullish SPY and IWM positions I held into the close. Note well I made all these moves without anticipating an end to the oversold trading conditions.
I took profits on a calendar put spread on VanEck Semiconductor ETF (SMH); this position replaced an earlier SMH put spread that I closed in the green. As the market’s reversal stretched, I jumped into an October SMH $165/$175 put spread as a hedge (recall that I decided to keep fading SMH as a hedge). I took profits on my XLI call option. I also doubled down on SLV $18 call options expiring next week (this position is now a long shot). Yet, I doubt I will add to bullish positions on Friday.
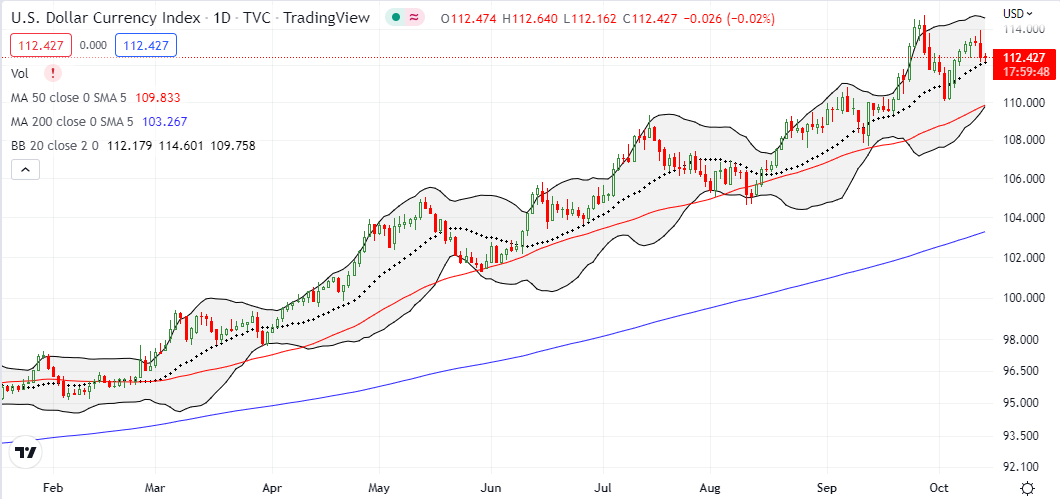
I am keeping an even closer eye on the U.S. dollar index (DXY). King dollar remains locked into a strong uptrend, but the day’s reversal may have created a double top. I will consider a close below the 50DMA (the red line below) to be a confirming move. An end to the uptrend in the dollar will signal the market’s expectation for a peak in interest rates and/or inflation (note well that expectation does not equate to certainty). In turn, such a signal should lock in a bottom for the stock market (of unknown duration of course).
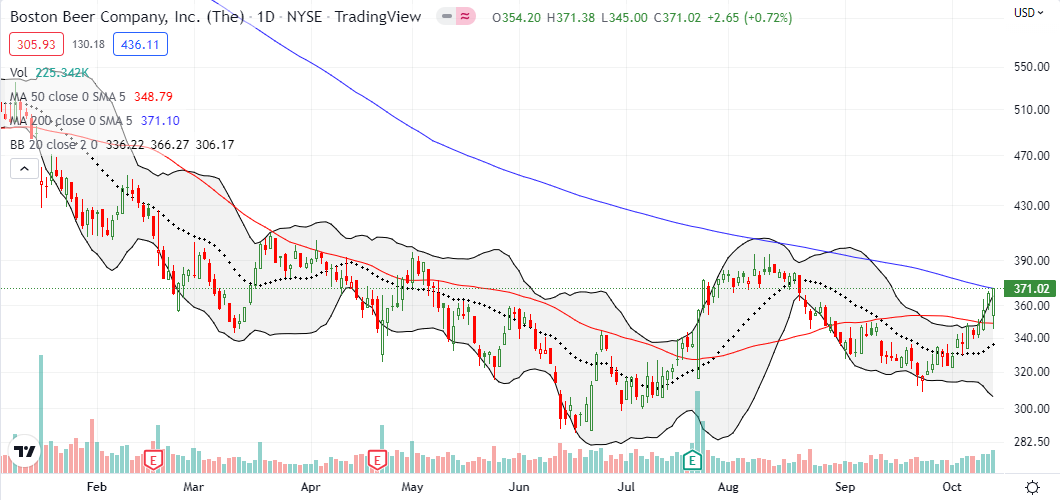
I keep patiently eyeing the Boston Beer Company (SAM) for a new, hopefully successful, trade. September’s low created a higher low ahead of this week’s 50DMA breakout and test of 200DMA resistance. A confirmed 200DMA breakout gets me back in SAM even if the August highs are not (yet?) broken down.
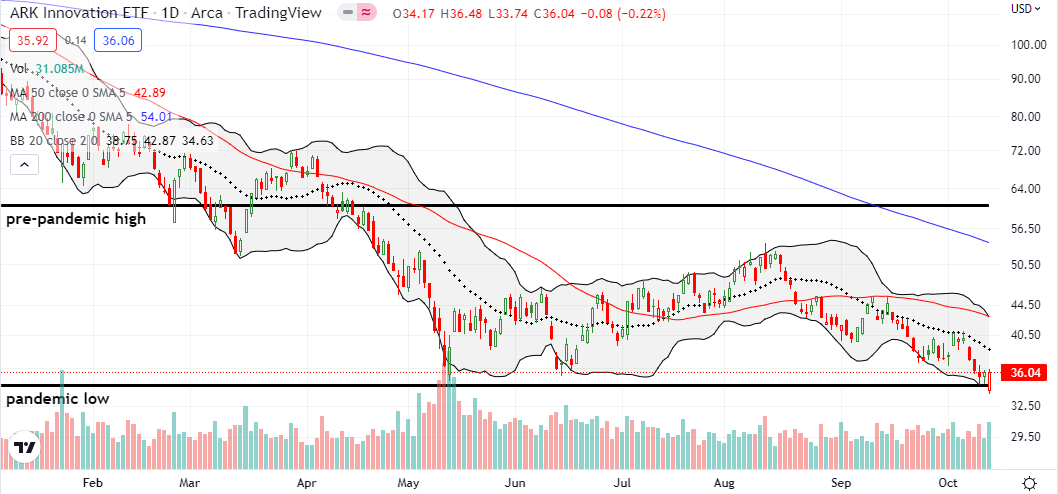
Two days after critiquing Cathie Wood’s open letter to the U.S. Federal Reserve, I found myself adding a few more shares of ARK Innovation ETF (ARKK). I rationalized the move after seeing the (imperfect) bounce off the pandemic low. I see this roundtrip to the price that marked the bottom of a complete collapse as a logical conclusion to the bottom falling out of the ARK Funds.
Still, I am not yet ready to fly unaccompanied by hedges. I opened a calendar put spread ($33/$34) that will give me a solid hedge for next week as the short side should expire worthless Friday. Also note well that ARKK greatly under-performed the market with its 0.2% loss on the day. I would like to think the general lack of interest in ARK fund speculation on the day is a constructive sign that the market’s bottoming signals are relatively solid. (Only ARKQ ended the day with gains).
My next ARK moves will depend on how healthy the market looks in a week.
Be careful out there!
Footnotes
“Above the 50” (AT50) uses the percentage of stocks trading above their respective 50-day moving averages (DMAs) to measure breadth in the stock market. Breadth defines the distribution of participation in a rally or sell-off. As a result, AT50 identifies extremes in market sentiment that are likely to reverse. Above the 50 is my alternative name for “MMFI” which is a symbol TradingView.com and other chart vendors use for this breadth indicator. Learn more about AT50 on my Market Breadth Resource Page. AT200, or MMTH, measures the percentage of stocks trading above their respective 200DMAs.
Active AT50 (MMFI) periods: Day #1 over 20% (overperiod ending 4 days oversold), Day #18 under 30%, Day #23 under 40%, Day #25 under 50%, Day #33 under 60%, Day #34 under 70%
Source for charts unless otherwise noted: TradingView.com
Full disclosure: see above for positions in addition to net short the U.S. dollar
FOLLOW Dr. Duru’s commentary on financial markets via StockTwits, Twitter, and even Instagram!
*Charting notes: Stock prices are not adjusted for dividends. Candlestick charts use hollow bodies: open candles indicate a close higher than the open, filled candles indicate an open higher than the close.


1 thought on “THIS CPI Shocker Ended Oversold Trading With A Bullish Signal – The Market Breadth”