Stock Market Commentary:
September was somber. October so far is a sugar high in comparison. With the remaining pandemic era gains preserved for now, the major indices immediately face the challenge of downtrends in place since August’s peak. The conclusion of an extended (8 days long) oversold trading period means, according to history, that at least one more oversold period may still await traders in the near-term. October is the last of the stock market’s most dangerous months, so accordingly I find it difficult to celebrate a buyer’s victory right out the gate. It is particularly hard to celebrate with the frenetic swings from despair to elated anticipation of things like Fed pivots, central bank capitulations, and peak inflation. Still, I will follow the technicals where they lead.
The Stock Market Indices
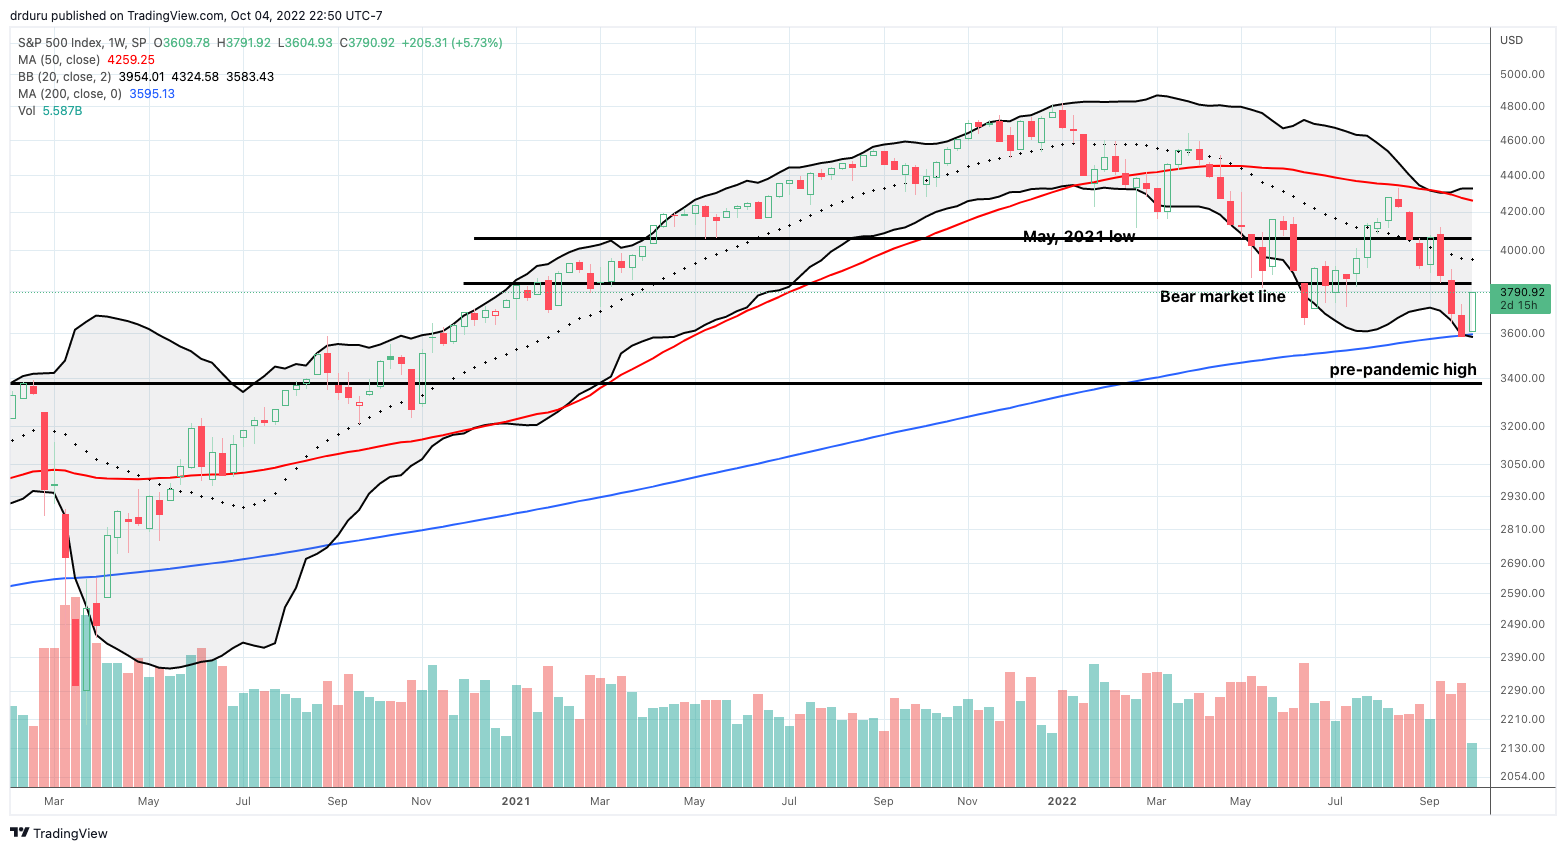
The S&P 500 (SPY) reversed course sharply enough to close just short of converged resistance at its downtrending 20-day moving average (DMA) and the bear market line. In two days, the index gained a sugar high 5.7%. Trading volume supports the case for the bulls. The green and red vertical bars in the chart below show a steady uptrend since late September and continuing through the swift buying that started this month with a sugar high.
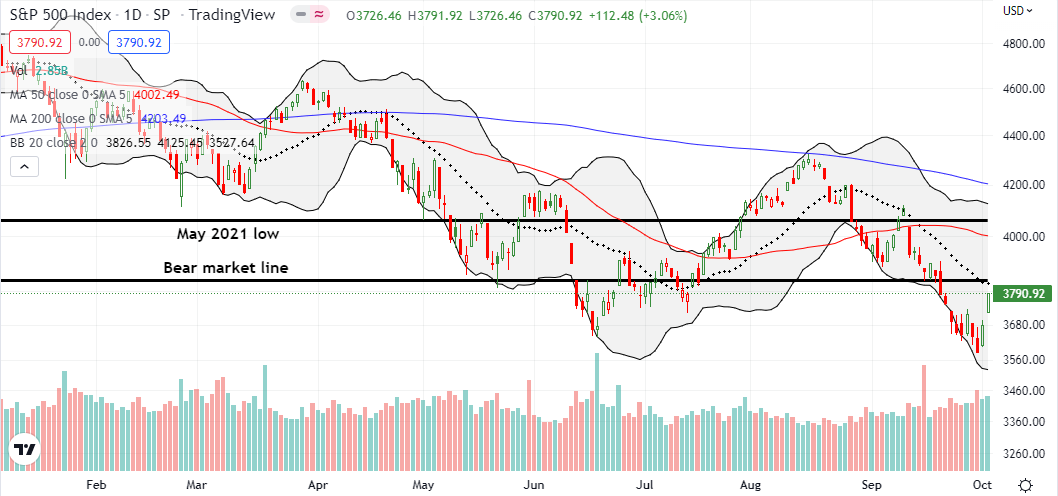
The “technosphere” was breathless over a historic test of support at the 200-week moving average. The technicians and sympathetic trading bots delivered with another display of trading poetry. What a fantastic way to bring the latest oversold trading period to an end.
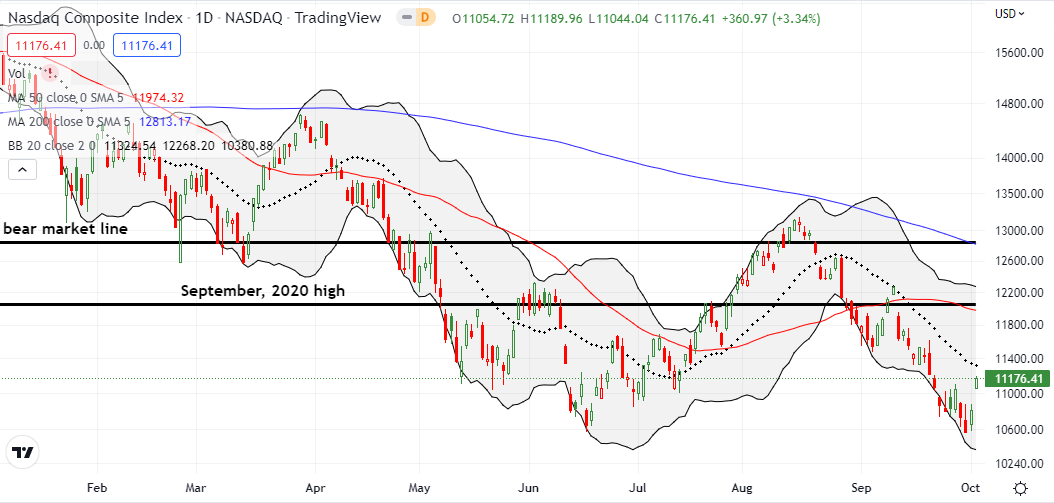
The NASDAQ (COMPQ) matched the S&P 500’s 2-day gain with the same 5.7% sugar high. Also like the S&P 500, the tech-laden index is immediately facing overhead resistance from its 20DMA, a line of resistance that has stood firm since August. The bear market line is still floating high in the trading atmosphere for the NASDAQ.
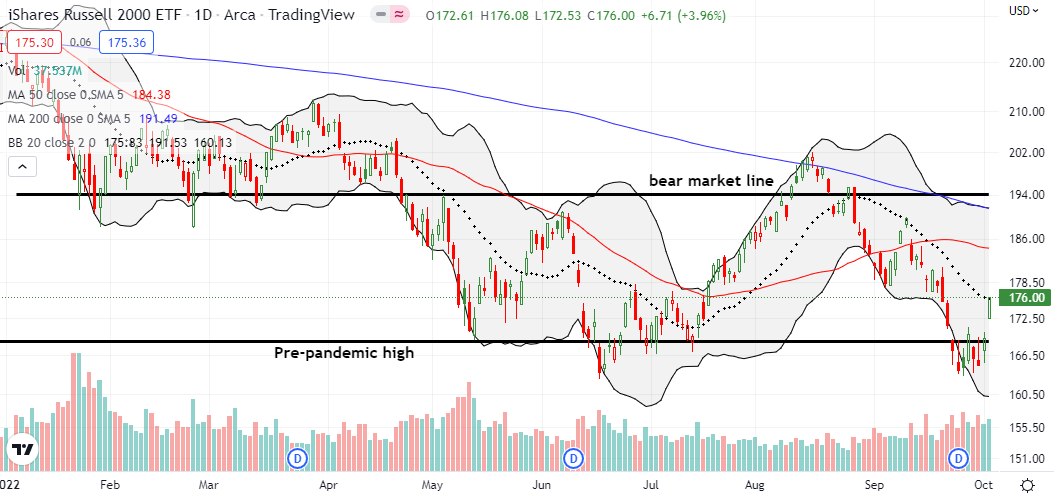
The iShares Russell 2000 ETF (IWM) did the S&P 500 and the NASDAQ one better again. A 4.0% surge slammed IWM right into its 20DMA resistance. I am watching IWM closely for evidence that buyers still have the fuel to push higher. Failure here would immediately open the prospect for a resumption of the downtrend.
Stock Market Volatility
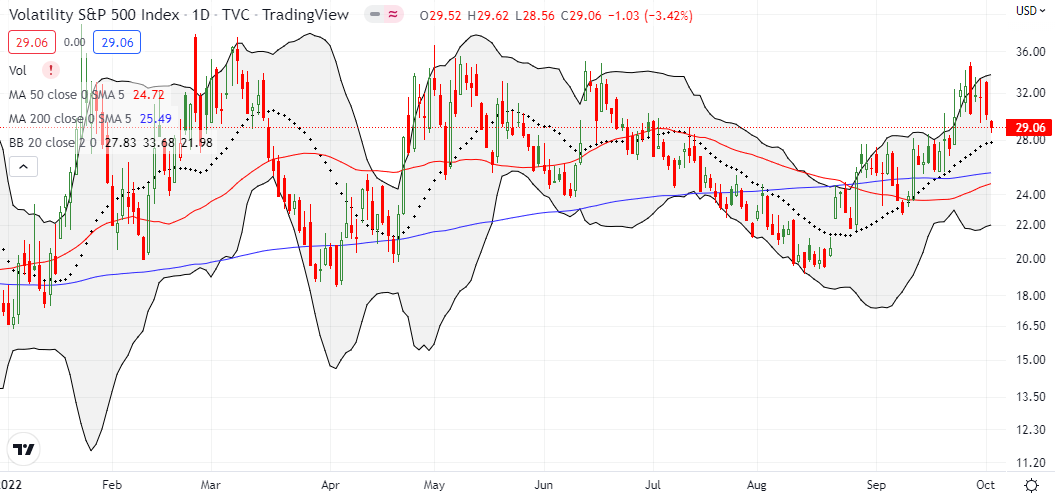
The sugar high brought an immediate end to the volatility index’s (VIX) test of the June highs. However, today’s 3.4% decline was much smaller than I would have expected for such a strong rally day. Moreover, just as the 20DMA downtrends on the major indices remain intact, the VIX is still comfortably sitting in its uptrend in place since the August lows.
The Short-Term Trading Call With A Sugar High
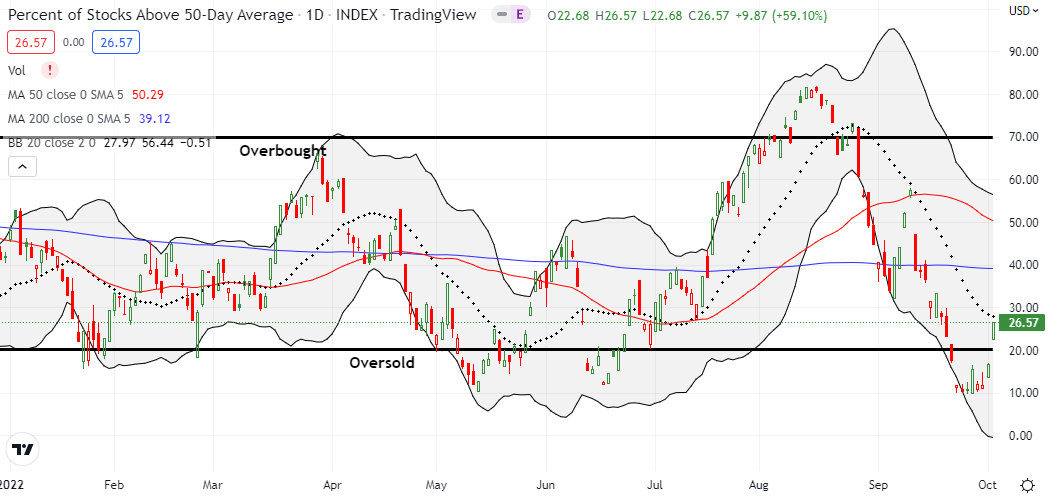
- AT50 (MMFI) = 26.6% of stocks are trading above their respective 50-day moving averages
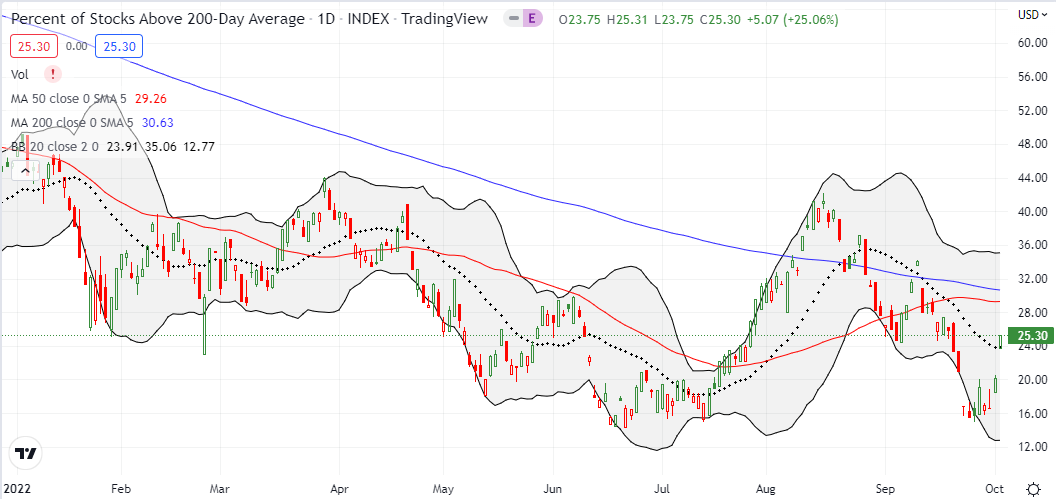
- AT200 (MMTH) = 25.3% of stocks are trading above their respective 200-day moving averages
- Short-term Trading Call: cautiously bullish
AT50 (MMFI), the percentage of stocks trading above their respective 50DMAs, surged from oversold territory at 16.7% to a close of 26.6%. The 10 percentage point surge brought an 8-day oversold period to a dramatic end. The oversold period was full of twists and turns, and my patience paid off with a number of oversold trades starting from attractive price points (the S&P 500 gained just 0.8% over the course of the oversold period). This 2-day sugar high is in itself so extreme, thus I was compelled to take profits on almost all my oversold period trades.
I am left with a QQQ put spread and short an SPY put spread. If IWM pushes higher, I will start a fresh tranche of bullish trades. Vertical call spreads look particularly attractive around key resistance levels. Even if the indices fail at resistance, I will NOT flip bearish. Instead, I will await the next collection of (oversold) buying signals.
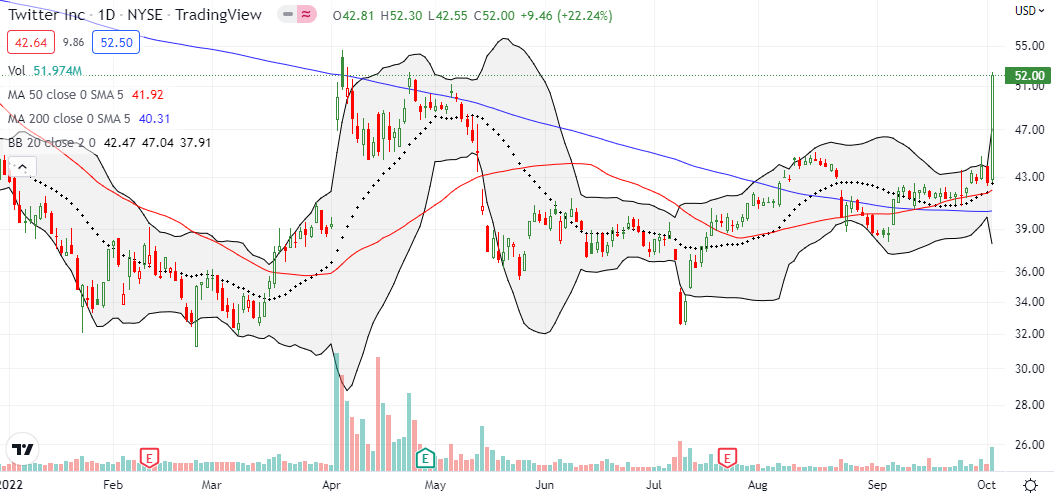
Today’s 22.2% surge in Twitter (TWTR) was a marquee move for a day of extremes. The sugar high brought the Elon Musk buyout drama closer to an end. Musk and his legal team seem ready to capitulate to the original terms of the deal. I heard speculation that Musk likely wanted to avoid a trial where a disposition could ask him just about any question. This is one lesson of market discipline that Musk will not escape!
Last week, I just happened to sell an October $45.50 call option to cover a portion of my position. It was a partial hedge against some downside drama once the trial started. I harbor no regrets since a Musk pre-trial capitulation seemed like a very remote possibility. My overall TWTR thesis worked out, and I am gratified I remained resolute on this one. Still, I sure will miss TWTR the ticker.
Be careful out there!
Footnotes
“Above the 50” (AT50) uses the percentage of stocks trading above their respective 50-day moving averages (DMAs) to measure breadth in the stock market. Breadth defines the distribution of participation in a rally or sell-off. As a result, AT50 identifies extremes in market sentiment that are likely to reverse. Above the 50 is my alternative name for “MMFI” which is a symbol TradingView.com and other chart vendors use for this breadth indicator. Learn more about AT50 on my Market Breadth Resource Page. AT200, or MMTH, measures the percentage of stocks trading above their respective 200DMAs.
Active AT50 (MMFI) periods: Day #1 over 20% (ending 8-day oversold period), Day #11 under 30%, Day #16 under 40%, Day #18 under 50%, Day #26 under 60%, Day #27 under 70%
Source for charts unless otherwise noted: TradingView.com
Full disclosure: long QQQ put vertical and calendar spreads, short SPY put spread, long TWTR shares and short a call option
FOLLOW Dr. Duru’s commentary on financial markets via StockTwits, Twitter, and even Instagram!
*Charting notes: Stock prices are not adjusted for dividends. Candlestick charts use hollow bodies: open candles indicate a close higher than the open, filled candles indicate an open higher than the close.


You timed that nicely. Could be wild day today with OPEC+ probably going to drastically cut production to keep oil prices high (so Russia can fund its war machine) which will send oil back up and the possibility of inflation going back up.
Oil is one of those wildcards way outside of the Fed’s control. The Fed could keep tightening and OPEC keep cutting! What a dynamic.
recipe for a recession…..only way out it increase domestic energy production….
I was just listening to a segment on oil on Fast Money (CNBC). It never ceases to amaze me how people can come up with equally convincing cases on the bearish and bullish sides of oil. 🙂