Stock Market Commentary
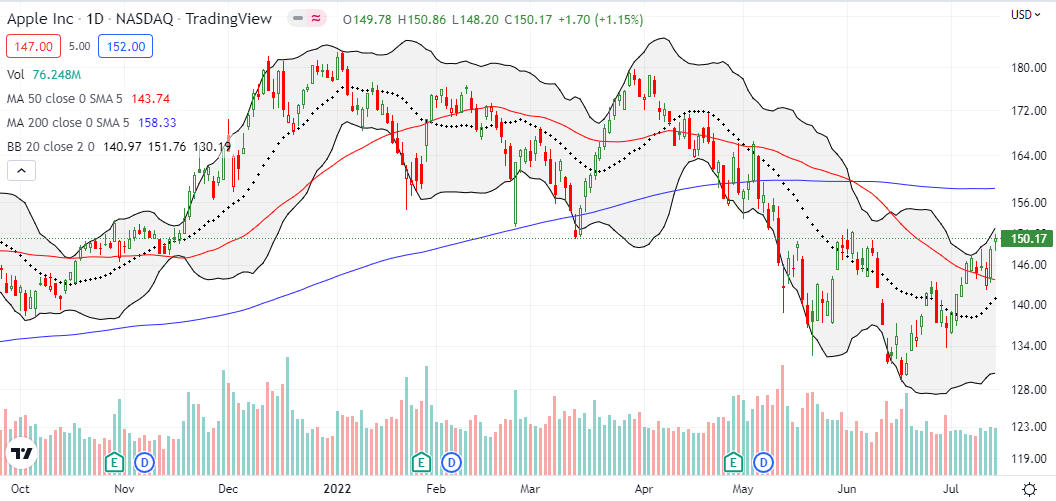
Last week’s scene from the summer of discontent included hand-wringing over the June inflation report. However, almost “quietly”, Apple Inc (APPL) pulled off a technical breakout contrary to the current bear market (especially for technology stocks). The previous week, AAPL confirmed a breakout above resistance at its 50-day moving average (DMA) (the red line below) but proceeded to drift and follow the still downtrending 50DMA lower. Last Thursday, AAPL soared 2.1% off 50DMA support. Friday’s 1.2% gain printed a firmer confirmation of the 50DMA breakout. AAPL was last this high 6 weeks ago. This move places Apple among the bear market green shoots I described almost two weeks ago. However, with the NASDAQ still stuck in a bear market, this move also looks like Apple’s bear market tease. Is it too good to be true?
The Stock Market Indices
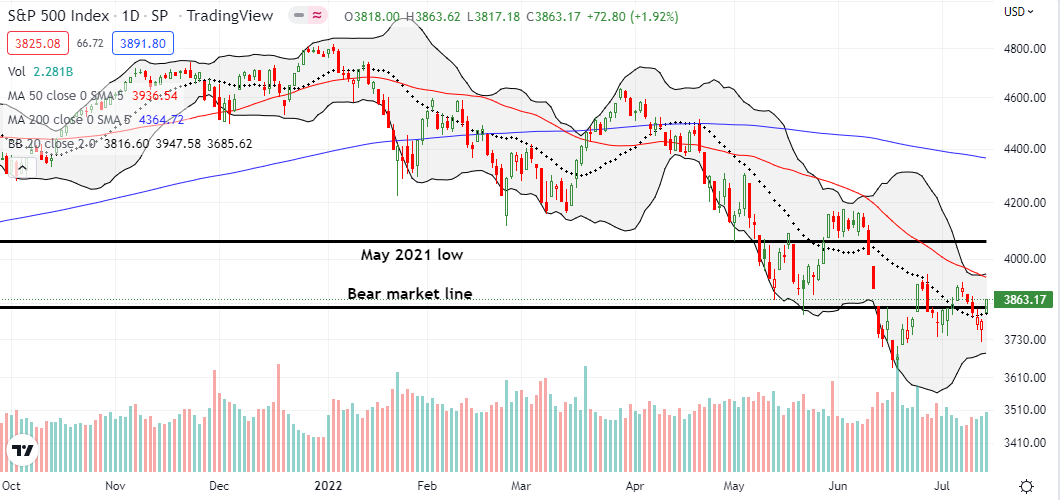
The S&P 500 (SPY) ended the week with its third appearance above bear market territory in the last month. Apple’s bear market tease suggests to me that the index may finally be ready to challenge overhead resistance at its 50DMA. Still, I sold my latest tranche of SPY shares into the 1.9% gain to trim the bullish side of my short-term trading exposure. Will the third time really be the charm?
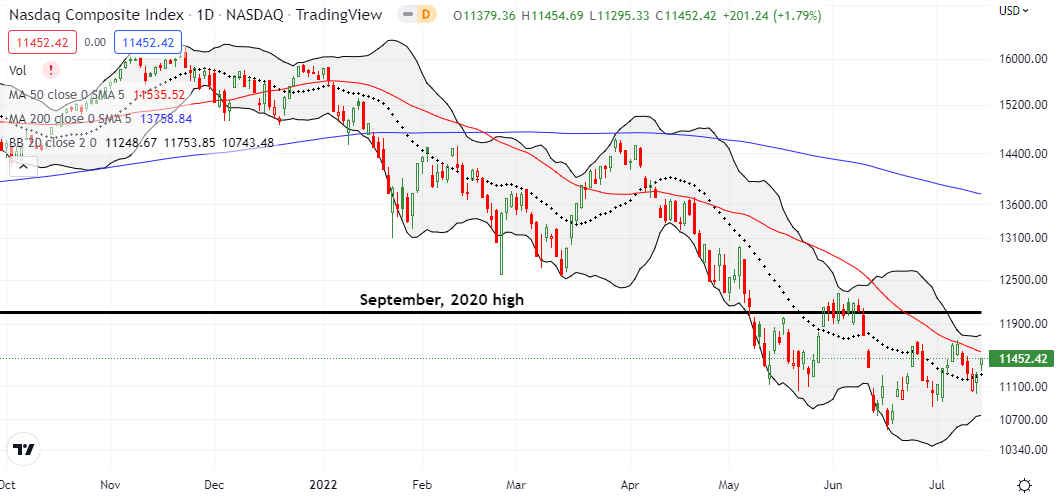
The NASDAQ (COMPQ) is still limping along below 50DMA resistance. This churn really makes Apple’s bear market tease so tantalizing. The tech-laden index needs to contend with 50DMA resistance and then the recent double-top from the last two peaks.
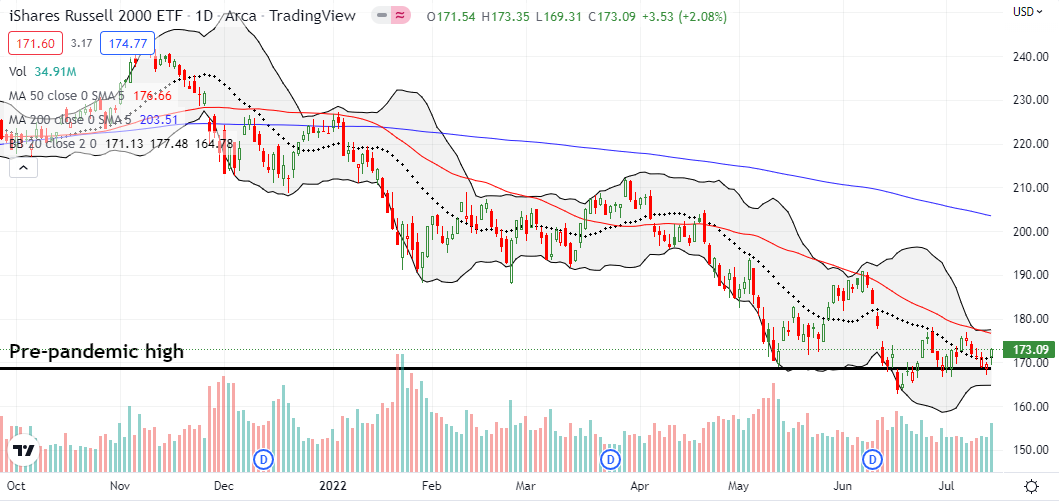
The drift downward for the iShares Russell 2000 ETF (IWM) took the ETF of small cap stocks right back to support at its pre-pandemic high. I am still clinging to a call option, so I am now looking for continuation to take IWM back to 50DMA resistance.
Stock Market Volatility
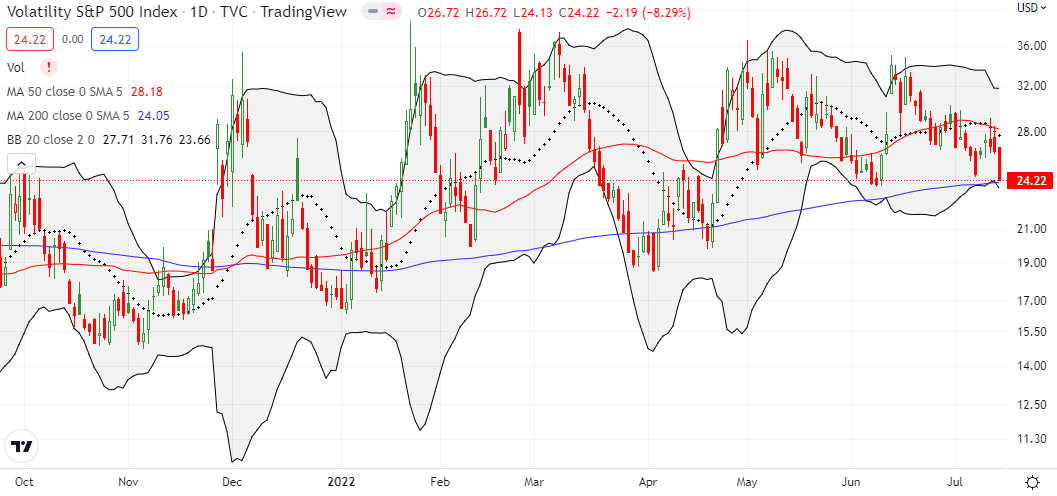
The volatility index (VIX) quickly returned to limping along. Friday’s stock market rally took the VIX right to the June lows. This test adds to the tantalizing feel of Apple’s bear market tease. If the VIX breaks through the June lows, the market should get a fresh whiff of anti bear market feeling and follow Apple higher.
The Short-Term Trading Call With Apple’s Bear Market Tease
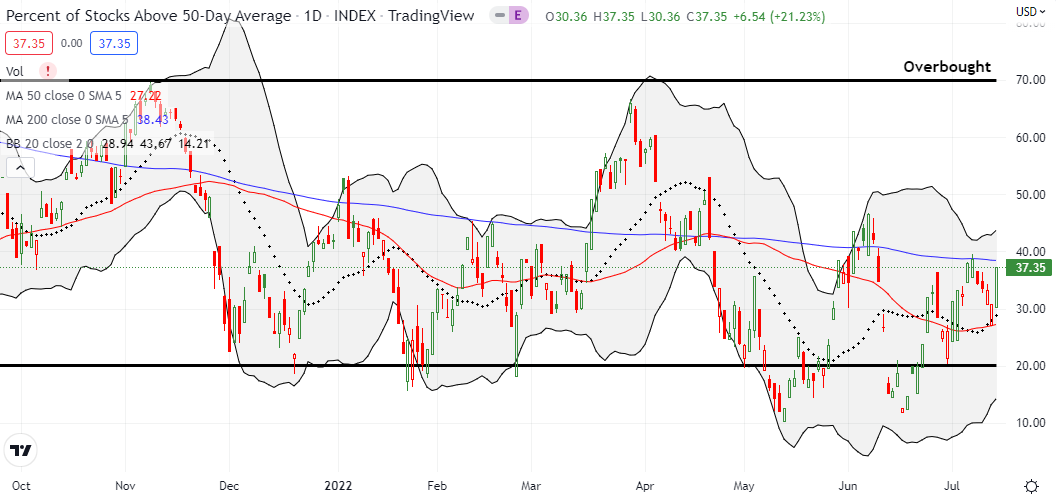
- AT50 (MMFI) = 37.4% of stocks are trading above their respective 50-day moving averages
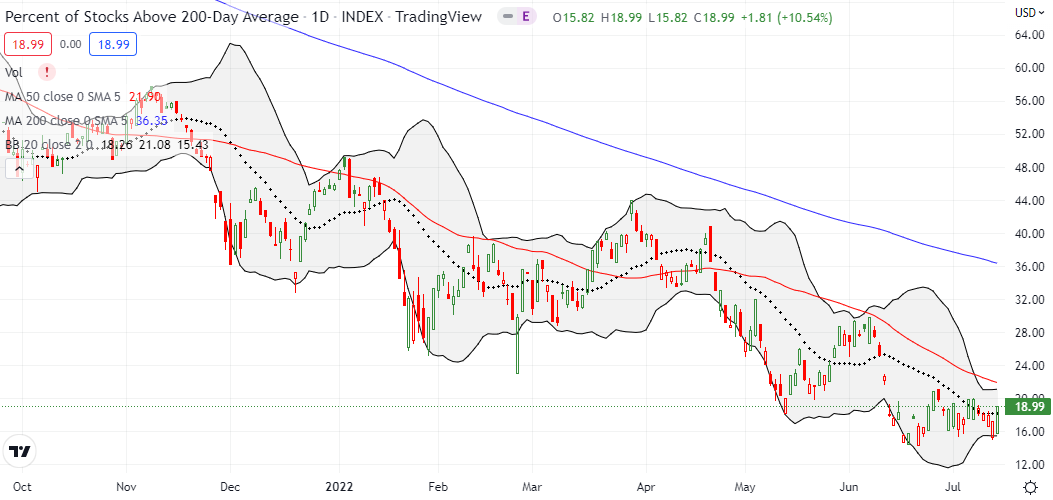
- AT200 (MMTH) = 19.0% of stocks are trading above their respective 200-day moving averages
- Short-term Trading Call: neutral
AT50 (MMFI), the percentage of stocks trading above their respective 50DMAs, jumped over 6 percentage points and confirmed broad based buying pressure on Friday. The surge was like a delayed reaction to Apple’s surge the prior day. If the stock market continues taking cues from Apple, its bear market tease could go from tantalizing to satisfying.
Speaking of satisfying, Fundstrat’s Tom Lee was back to talking big bullish game on CNBC. Despite his fund’s technician calling for a lower low on the market still to come in July, Lee is confident in a strong second half of the year. Talk about a tease! I still have every reason to stay short-term neutral. A lower low on the market should deliver the oversold conditions that would flip me back to bullish. I would love to ride that bullishness for the rest of the year.
All eyes on Apple? The company reports earnings on July 28th…a day after the Fed issues its next missive on monetary policy. What a combination!
Be careful out there!
Footnotes
“Above the 50” (AT50) uses the percentage of stocks trading above their respective 50-day moving averages (DMAs) to measure breadth in the stock market. Breadth defines the distribution of participation in a rally or sell-off. As a result, AT50 identifies extremes in market sentiment that are likely to reverse. Above the 50 is my alternative name for “MMFI” which is a symbol TradingView.com and other chart vendors use for this breadth indicator. Learn more about AT50 on my Market Breadth Resource Page. AT200, or MMTH, measures the percentage of stocks trading above their respective 200DMAs.
Active AT50 (MMFI) periods: Day #12 over 20%, Day #6 over 30% (overperiod), Day #22 under 40%, Day #66 under 50%, Day #71 under 60%, Day #342 under 70%
Source for charts unless otherwise noted: TradingView.com, Credit for photo of bears eating apples: @SteveWinterPhoto as seen on twitter and People Magazine.
Full disclosure: long QQQ put spread, long SPY call spread, long IWM call
FOLLOW Dr. Duru’s commentary on financial markets via StockTwits, Twitter, and even Instagram!
*Charting notes: Stock prices are not adjusted for dividends. Candlestick charts use hollow bodies: open candles indicate a close higher than the open, filled candles indicate an open higher than the close.


