Stock Market Commentary
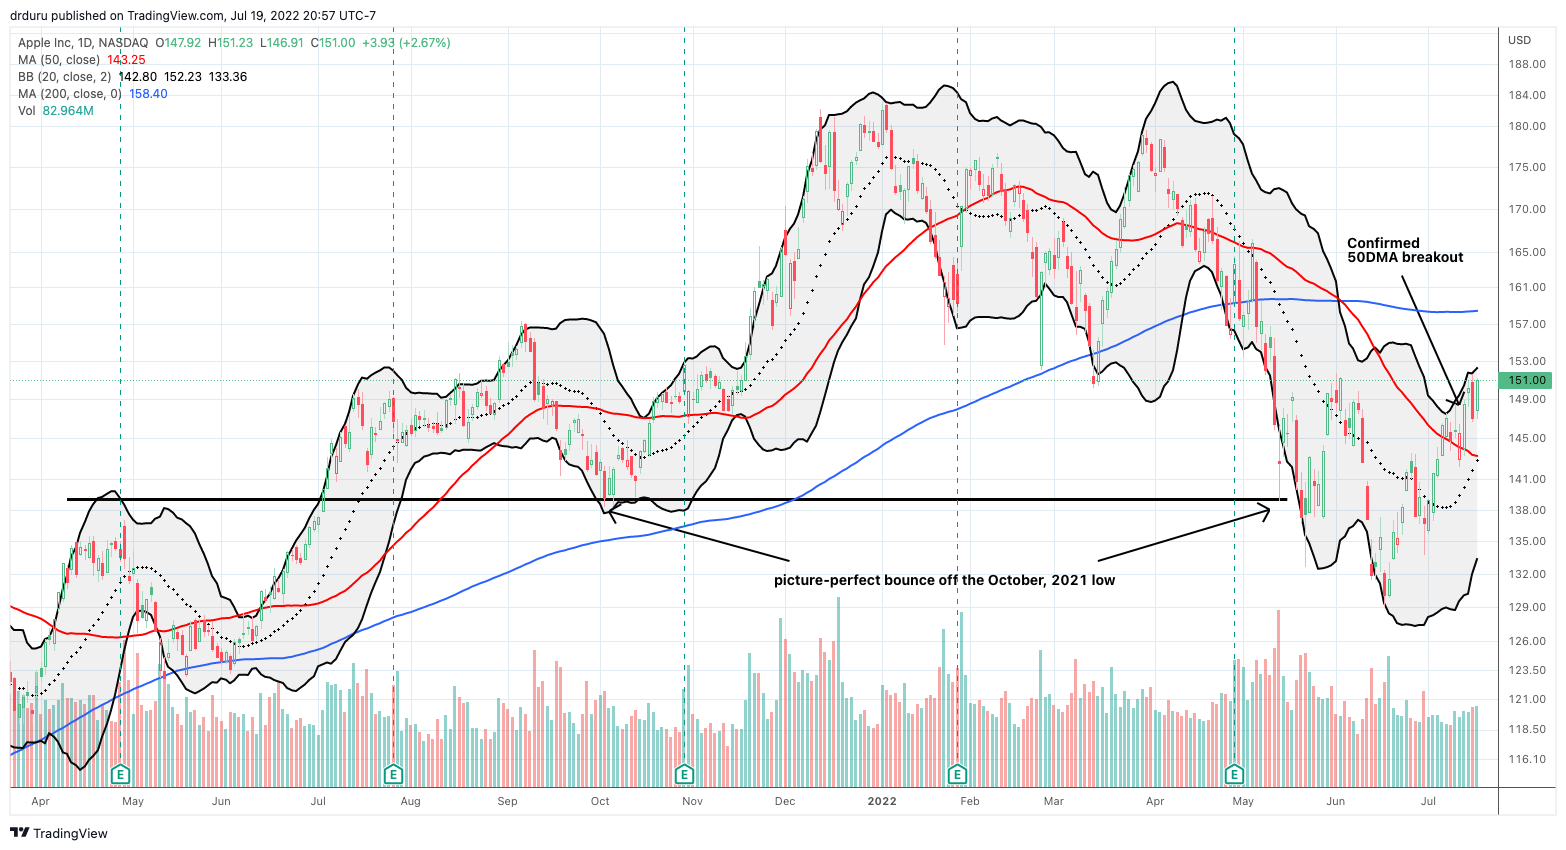
The synchronized breakout looked impossible just yesterday. Apple (AAPL) reversed course with a 2.1% loss that seemed to confirm recent strength was just a bear market tease. Rumors spread through the market that Apple will announce a hiring slowdown and reduced spending. Today, all was forgotten as the major indices all enjoyed synchronized breakouts above their respective resistance levels at their 50-day moving averages (DMAs) (the red line in the charts). For its part, AAPL returned to solidifying its own 50DMA breakout by returning yesterday’s losses to investors. Today was a day of soaring bear market hope with a distinct change in market tenor and sentiment.
The Stock Market Indices
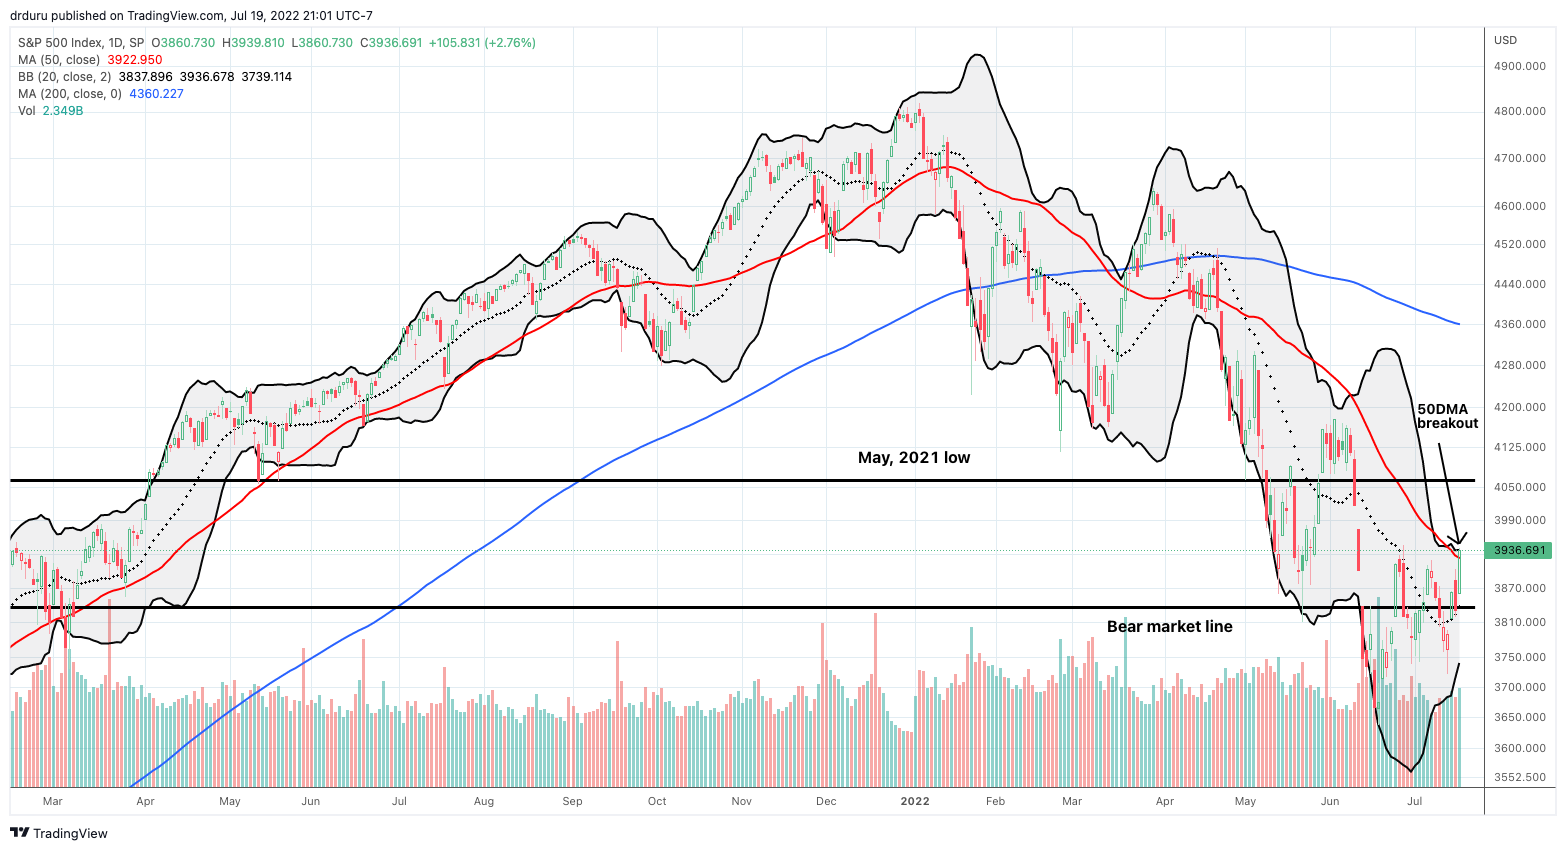
The S&P 500 (SPY) gained 2.8% and closed the day a notch above its 50DMA resistance. The index’s participation in the synchronized breakout looked tentative and needs confirmation with a higher close. Such a move will finally put resistance at the May, 2021 low back in play. The bear market for the S&P 500 could even start to shrink in size in the rear view mirror. Bear market hopes and dreams overflow with that kind of anticipation.
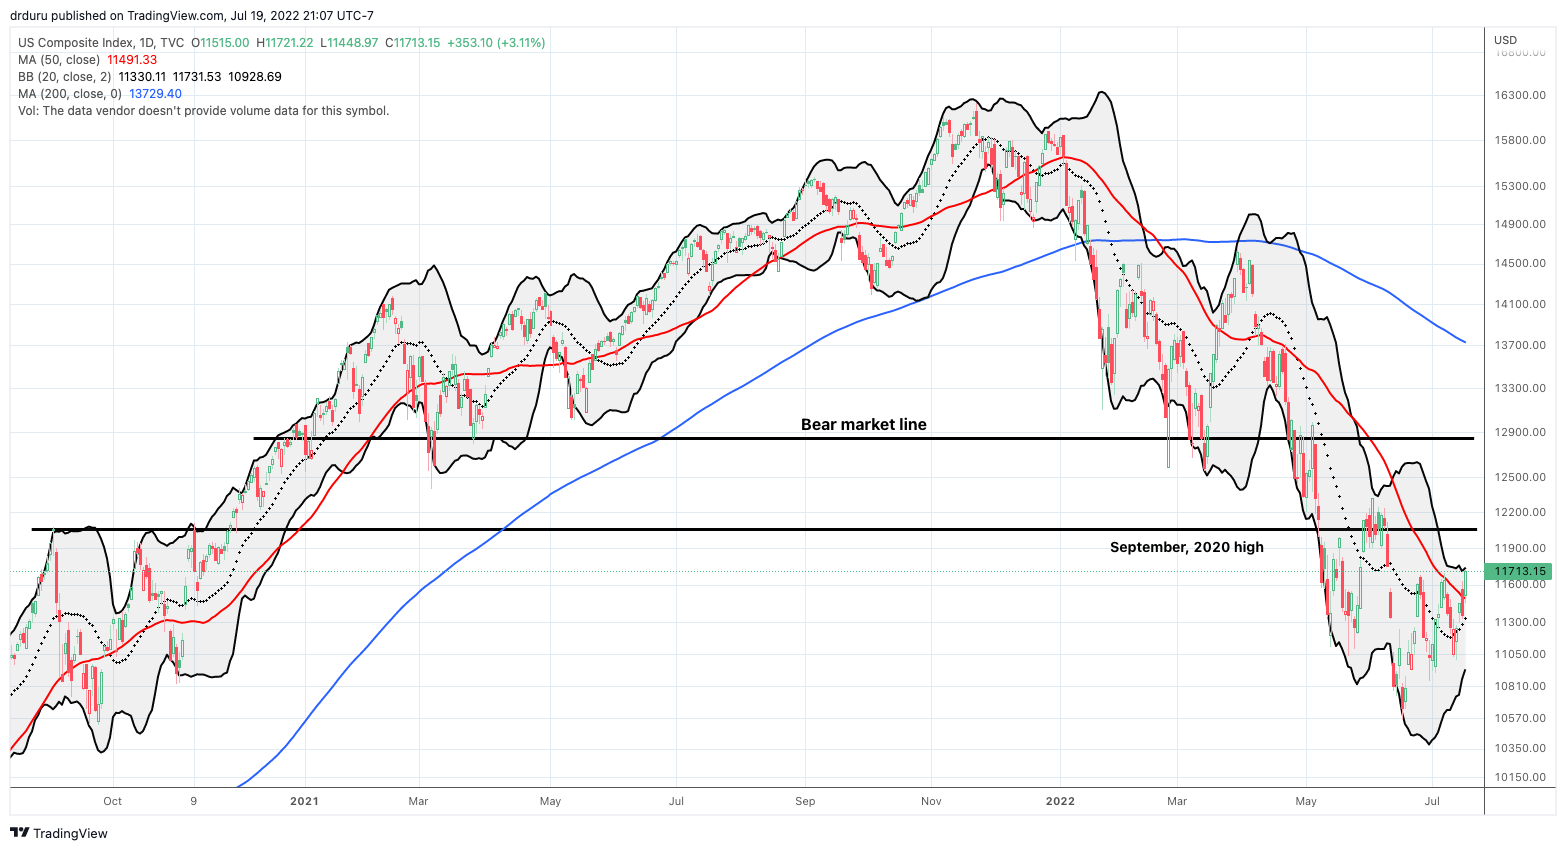
The NASDAQ (COMPQ) participated much more convincingly in the synchronized breakout. The tech-laden index gaped higher above its 50DMA and never looked back. Resistance at the September, 2020 high is back in play.
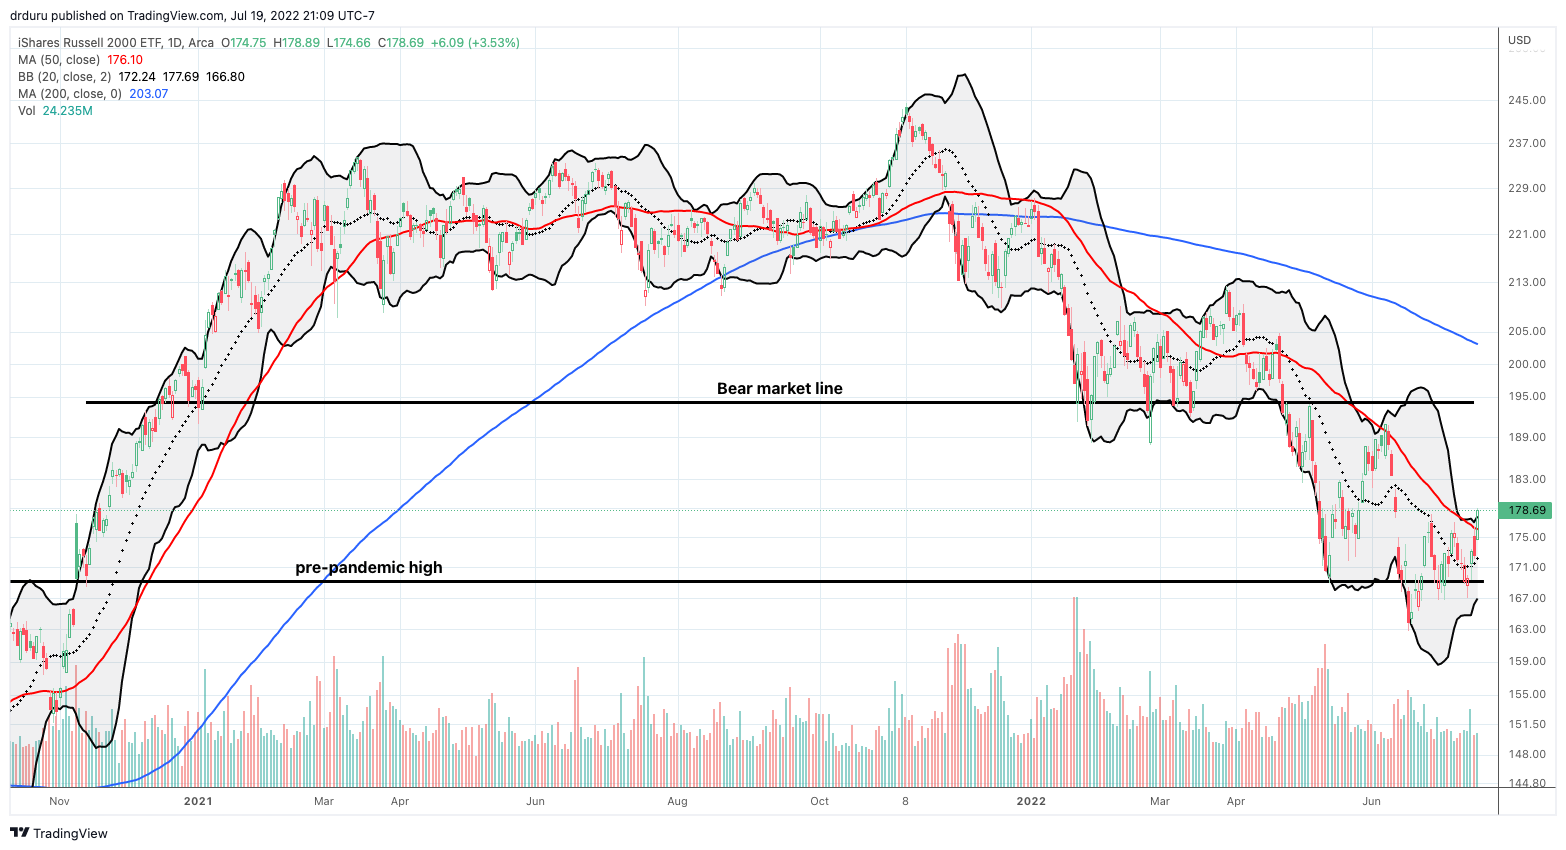
The iShares Russell 2000 ETF (IWM) transformed my fortuitous sale of my call option on Monday’s gap open into a failure of faith. Such are the trials of timing options trades. Like the NASDAQ, IWM printed a convincing signature on the contract for the synchronized breakout. The ETF of small caps delivered bear market hope with a 3.5% surge that sliced right through 50DMA resistance.
Stock Market Volatility
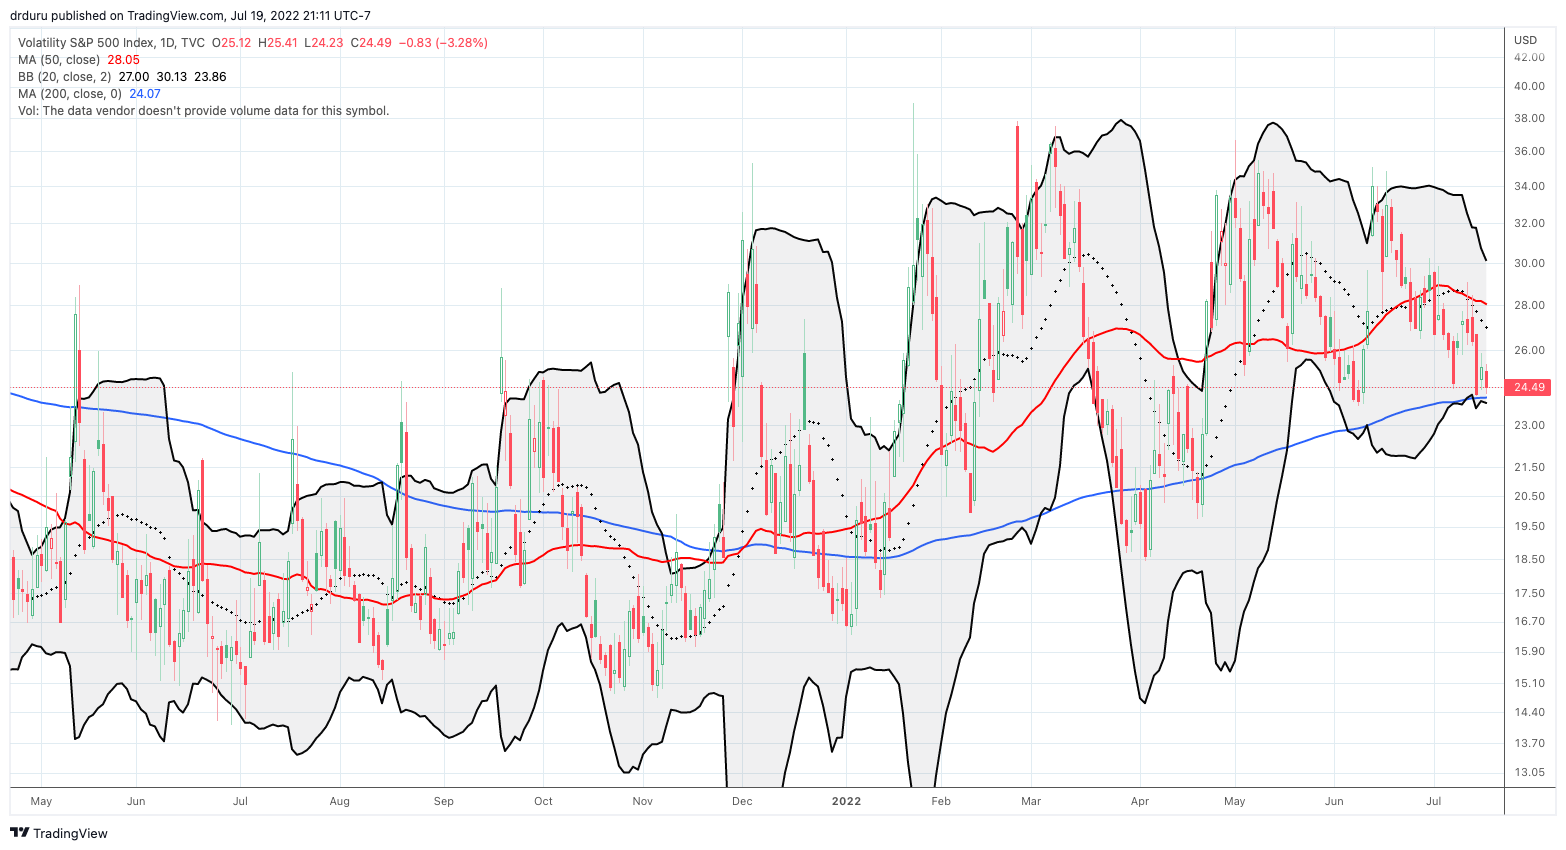
Surprisingly, the volatility index (VIX) did not confirm the otherwise bullish implications of the synchronized breakout. The VIX reversed yesterday’s gains but stopped short of last week’s low. Accordingly, the June low still stands as tantalizing support. As I noted earlier, a breakdown below the June low would deliver a convincing confirmation more bullish sentiment in the stock market. For now, the sentiment shift still looks like soaring bear market hope.
The Short-Term Trading Call With A Synchronized Breakout
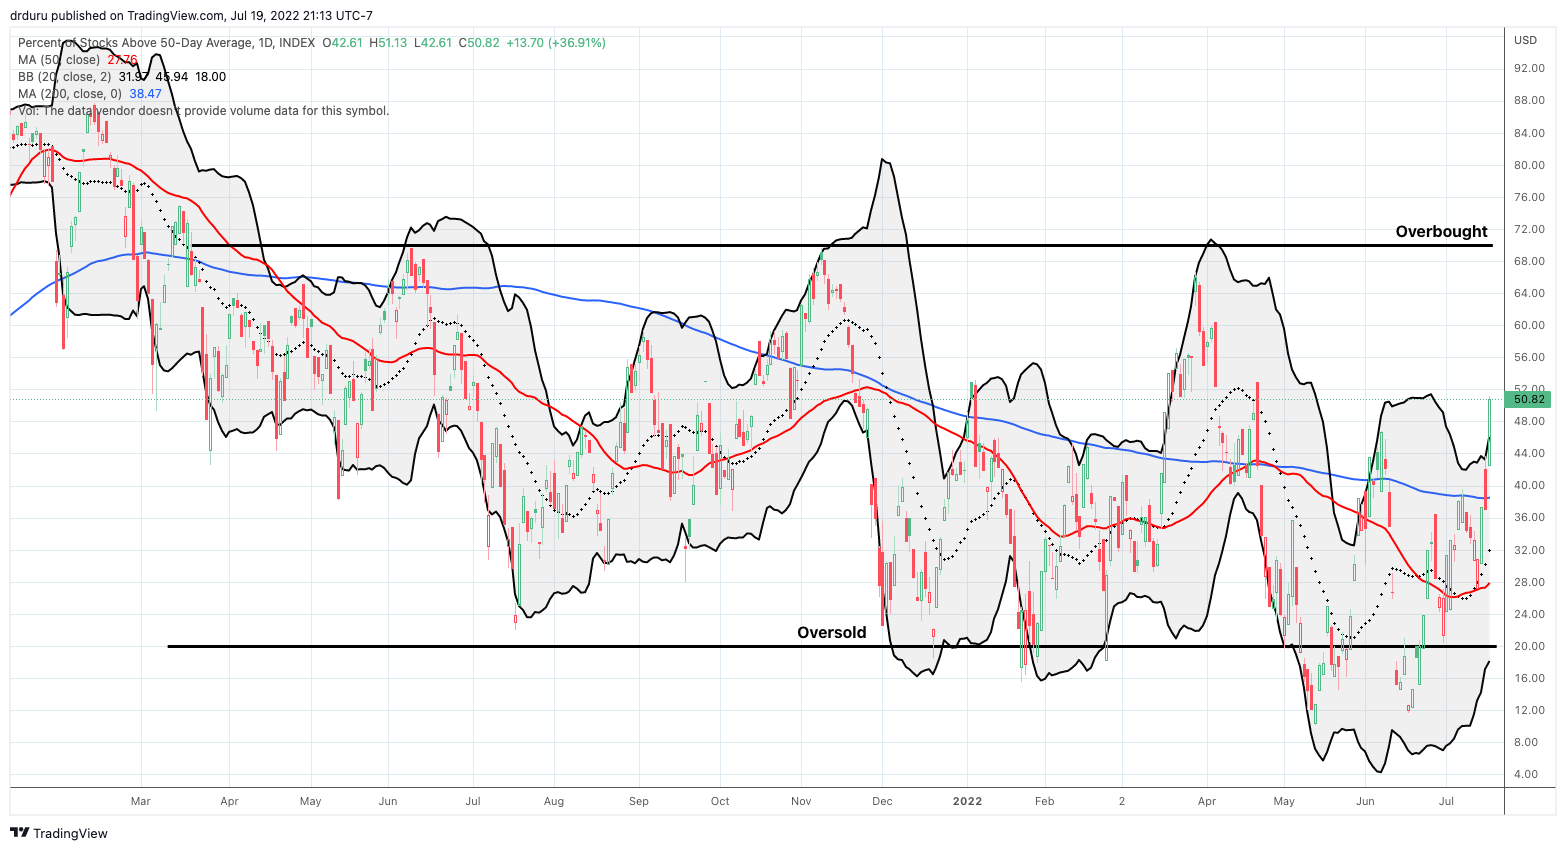
- AT50 (MMFI) = 50.8% of stocks are trading above their respective 50-day moving averages (a 3+ month high!)
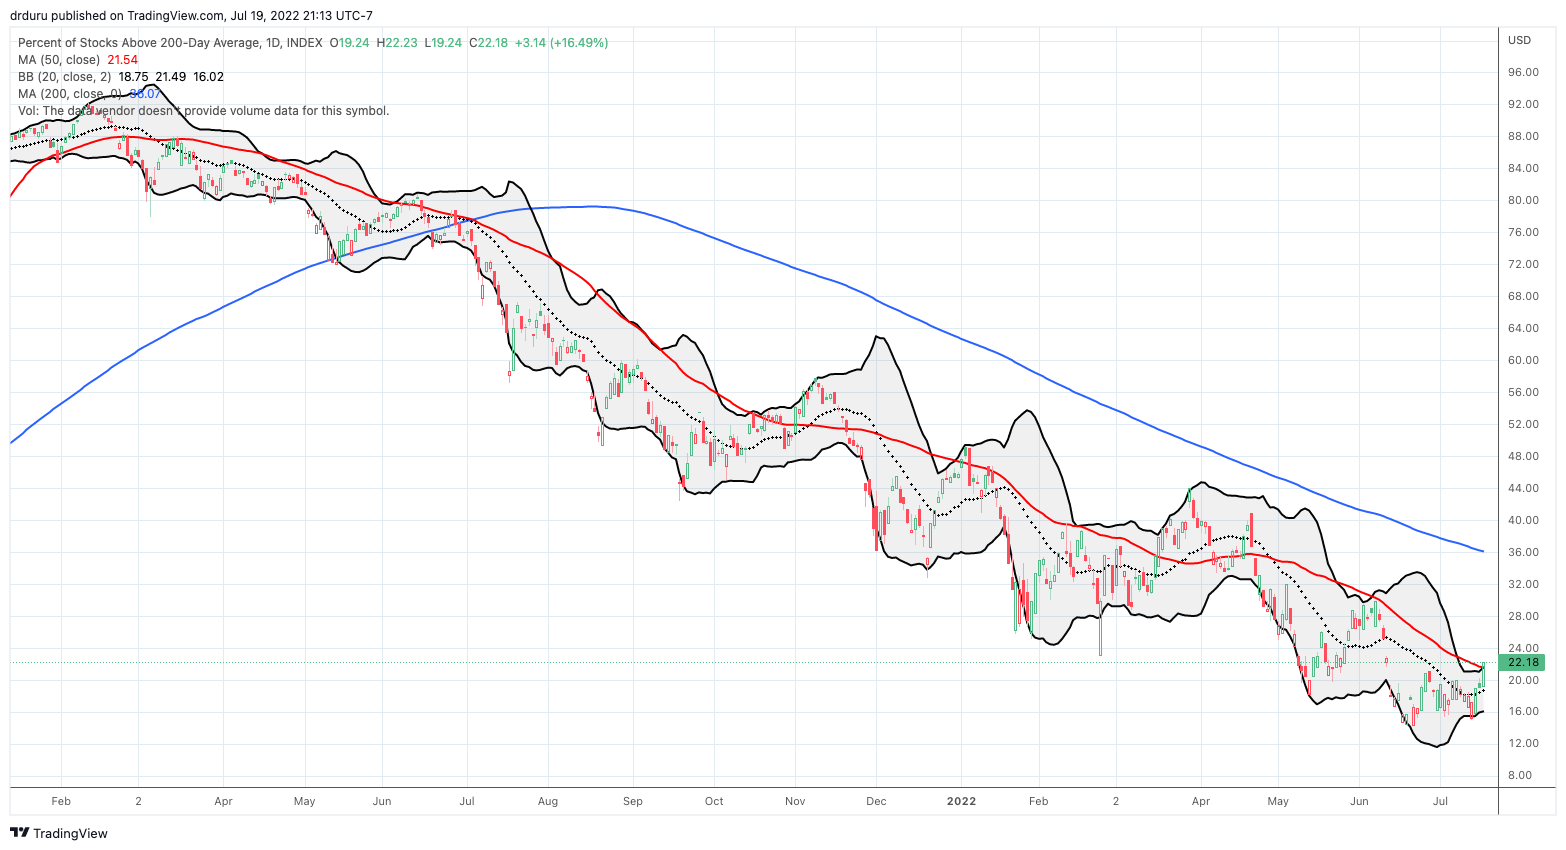
- AT200 (MMTH) = 22.2% of stocks are trading above their respective 200-day moving averages
- Short-term Trading Call: neutral
AT50 (MMFI), the percentage of stocks trading above their respective 50DMAs, recovered from yesterday’s fade to close at levels last seen in early April. The strong 14 percentage point move not only confirmed broad based participation in the synchronized breakout, but also my favorite technical indicator put an end to its primary downtrend. This soaring bear market hope now puts into play a fresh test of the overbought threshold. Perhaps Fundstrat’s Tom Lee was quite justified in bullishly overriding his fund’s technician after all!
Despite the refreshed bear market hopes, I am keeping the short-term trading call at neutral. Even if the stock market is now on a path to overbought conditions, I prefer to stay neutral to avoid churning the trading call if everything comes apart thanks to the Fed’s meeting next week. In the meantime, I definitely acknowledge technical conditions look a LOT more constructive now. The market just needs to see confirmation of the synchronized breakout with synchronized confirmations with higher closes.
Be careful out there!
Footnotes
“Above the 50” (AT50) uses the percentage of stocks trading above their respective 50-day moving averages (DMAs) to measure breadth in the stock market. Breadth defines the distribution of participation in a rally or sell-off. As a result, AT50 identifies extremes in market sentiment that are likely to reverse. Above the 50 is my alternative name for “MMFI” which is a symbol TradingView.com and other chart vendors use for this breadth indicator. Learn more about AT50 on my Market Breadth Resource Page. AT200, or MMTH, measures the percentage of stocks trading above their respective 200DMAs.
Active AT50 (MMFI) periods: Day #14 over 20%, Day #8 over 30%, Day #1 over 40%, Day #1 over 50% (overperiod ending 67 days under 50%), Day #73 under 60%, Day #344 under 70%
Source for charts unless otherwise noted: TradingView.com, Credit for photo of bears eating apples: @SteveWinterPhoto as seen on twitter and People Magazine.
Full disclosure: long QQQ put spread, long SPY call spread, long IWM call
FOLLOW Dr. Duru’s commentary on financial markets via StockTwits, Twitter, and even Instagram!
*Charting notes: Stock prices are not adjusted for dividends. Candlestick charts use hollow bodies: open candles indicate a close higher than the open, filled candles indicate an open higher than the close.


