Stock Market Commentary
The summer of discontent is proving more abrupt, sharp, and violent than I expected. The promising rally out of the shadow of the bear stopped cold at the steep downtrends formed by 20-day moving averages (DMAs) (the dotted lines in the charts below). A test of 50DMA resistance (the red lines below) is back on the shelf. However, a surprising rally right off the threshold of oversold trading conditions provided a fresh spark of promise. Of course, that hope is weak consolation after the end of the S&P 500’s fourth worst performing first half of the year in history.
The Stock Market Indices
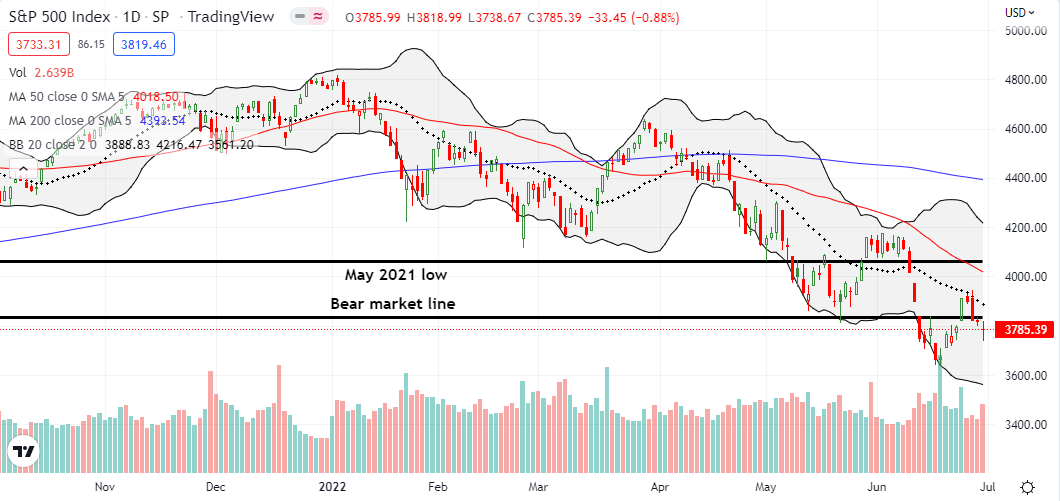
The S&P 500 (SPY) blew past its bear market line to end trading last week only to run out of gas this week. The end of quarter rally that I thought was underway turned into a complete head fake. Bears clearly reasserted themselves with a staunch defense of resistance at the downtrending 20DMA, one of the key steep downtrends. Yet somehow, buyers rallied price off the lows. Having missed the last rally in the S&P 500, I moved into SPY call spreads as market breadth hit the oversold threshold. More on these dynamics below.
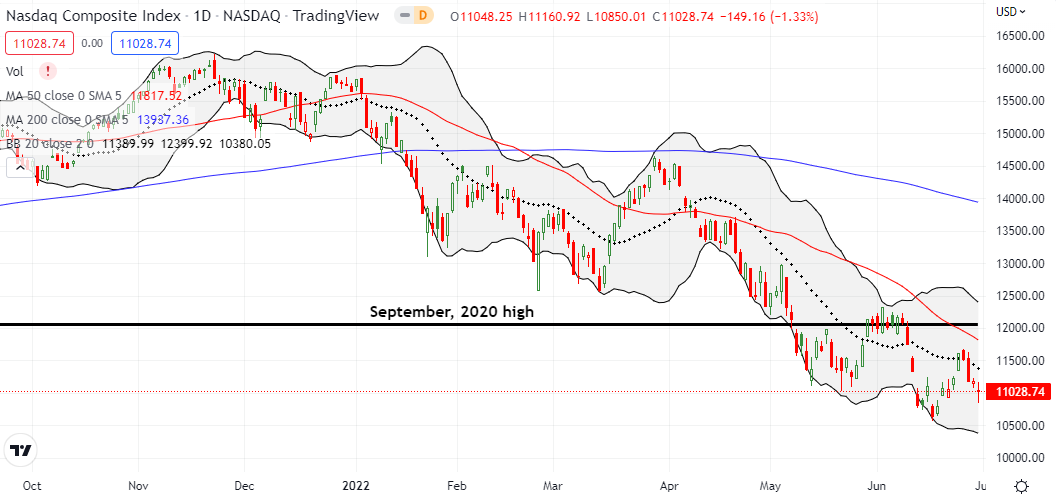
The NASDAQ (COMPQ) managed to close above its 20DMA at the end of last week. That milestone failed to matter. The tech-laden index faded in sync with the S&P 500’s major 20DMA failure. The buyer’s rally from the lows of the day closed the NASDAQ right at the May intraday low. I added a fresh tranche of QQQ call spreads on the previous day.
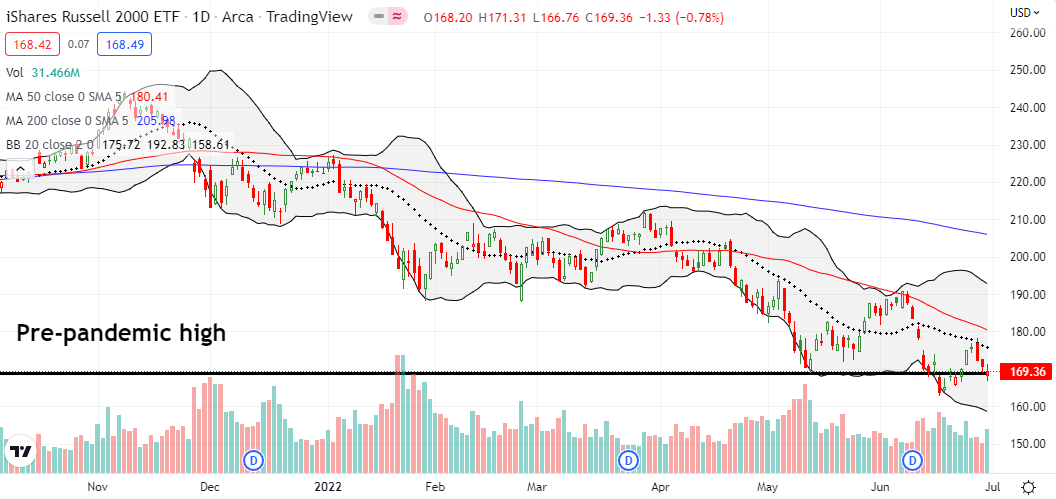
The iShares Russell 2000 ETF (IWM) maintained the theme of the steep downtrends from the 20DMA. However, the ETF of small caps managed to hold key support at its pre-pandemic high. I jumped into an IWM call spread for the first time in a while.
Stock Market Volatility
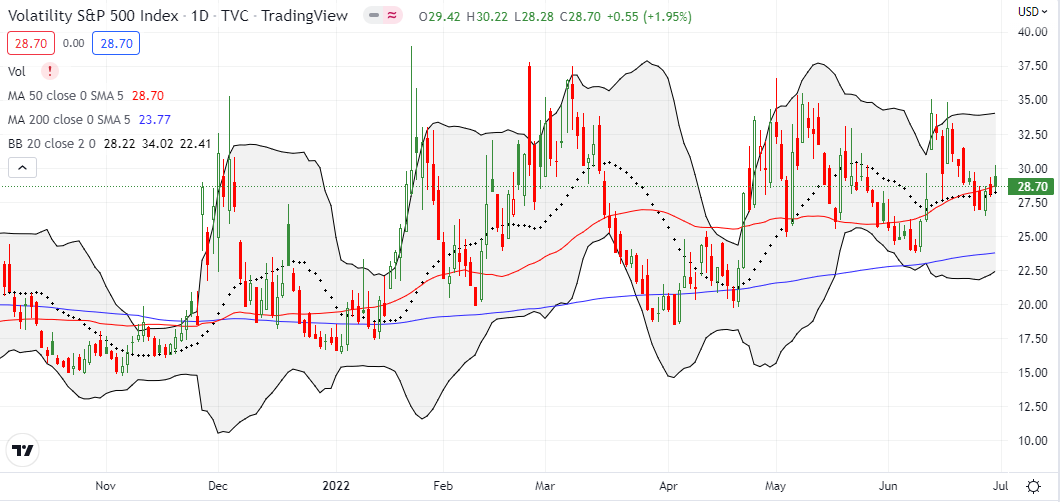
The volatility index (VIX) continues to move more lethargically than the summer of discontent spread all over equity trading. Despite the latest intraday angst and churn, the VIX only gained 2.0%. Moreover, faders took the VIX well off its lows. These moves belie the surface aggressiveness of the bears holding firm at the steep downtrends from the 20DMAs.
The Short-Term Trading Call With Steep Downtrends
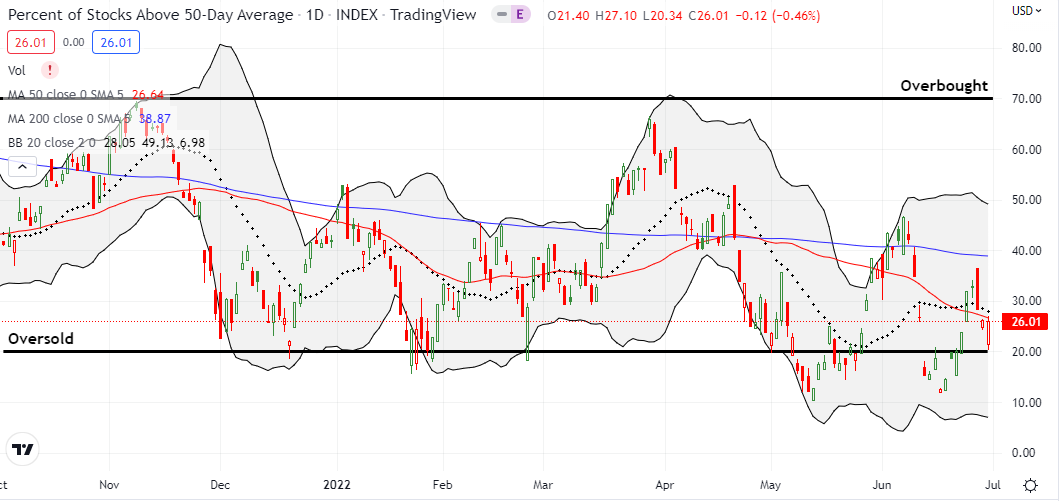
- AT50 (MMFI) = 26.0% of stocks are trading above their respective 50-day moving averages
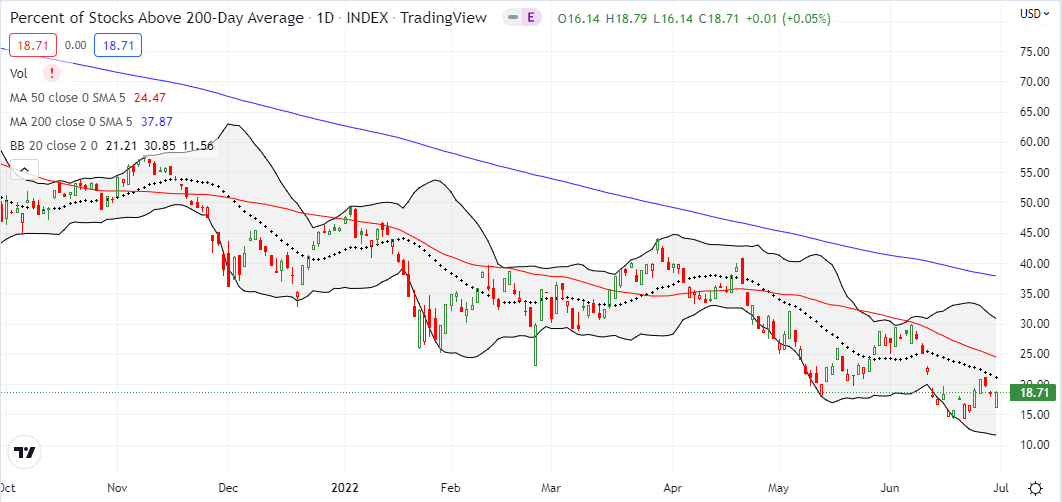
- AT200 (MMTH) = 18.7% of stocks are trading above their respective 200-day moving averages
- Short-term Trading Call: cautiously bullish
At the end of last week, AT50 (MMFI), the percentage of stocks trading above their respective 50DMAs, printed a convincing follow-through for ending the last oversold period. The bear market defense at the steep downtrends looked set to plunge the stock market right back into oversold conditions (below 20%), especially with the S&P 500 returning to bear market territory. Instead, buyers somewhere in the market bought enough stuff to rescue my favorite technical indicator from a return to oversold. It was another market breadth moment that forced me to blink multiple times.
The stiff resistance at 20DMAs created a buy the dip opportunity, but only IWM held key support. Still, market conditions looked extreme enough to motivate me into a fresh tranche of buying. Under most other circumstances, a close encounter with oversold trading conditions would be “close enough” to flip my trading call to a flavor of bullish. So I reached call options and call spread in one more anticipation of a reactionary bounce. The rebound from the oversold threshold was certainly a great start. However, buyers have a long way to go after this week’s latest victories by the bears.
Be careful out there!
Footnotes
“Above the 50” (AT50) uses the percentage of stocks trading above their respective 50-day moving averages (DMAs) to measure breadth in the stock market. Breadth defines the distribution of participation in a rally or sell-off. As a result, AT50 identifies extremes in market sentiment that are likely to reverse. Above the 50 is my alternative name for “MMFI” which is a symbol TradingView.com and other chart vendors use for this breadth indicator. Learn more about AT50 on my Market Breadth Resource Page. AT200, or MMTH, measures the percentage of stocks trading above their respective 200DMAs.
Active AT50 (MMFI) periods: Day #6 over 20% (overperiod), Day #3 under 30% (underperiod), Day #16 under 40%, Day #60 under 50%, Day #65 under 60%, Day #336 under 70%
Source for charts unless otherwise noted: TradingView.com
Full disclosure: long QQQ calls and put spread; long SPY call spreads, long IWM call spread
FOLLOW Dr. Duru’s commentary on financial markets via StockTwits, Twitter, and even Instagram!
*Charting notes: Stock prices are not adjusted for dividends. Candlestick charts use hollow bodies: open candles indicate a close higher than the open, filled candles indicate an open higher than the close.

Do you think market selling is done or going to get worse from here? Is it a good time to start accumulating stocks
Unfortunately, bears and sellers remain firmly in control of the market. I am only buying for bounces. Investors can be patient. Be on alert for the next leg down in the market. I would be buying favorite stocks at that point, especially if the next leg down happens in the seasonally weak period of August to October.