
Last week’s geo-political drama had all the makings of an escalation to all-out war. A country incensed about the assassination of its top general lobbed missiles at airbases its enemy occupies in a neighboring country. Everyone braced for the typical response of attacking the sites that lobbed the missiles. With its borders breached by the retaliation, the country next declares war. Its adversary scoffs and warns that the country will be annihilated in rapid fashion. The entire world holds its breath in fear of an even wider escalation.
Except escalation never came. The war that turned into a scuffle ended almost as quickly as it started. Both Iran and the U.S. declared victory and settled back into their previous trenches of geo-political tension.
Stock market futures plunged in immediate response to Iran’s attack, but the market decline only lasted for about two hours. Once trading in Asia officially opened, the bottom began. While the start of trading in Asia is a common time for bringing an end to overnight over-reactions, I was watching my favorite risk-on/risk-off indicator, the Australian dollar (FXA) versus the Japanese yen (FXY) (AUD/JPY) for clues. I often tout the benefits of watching AUD/JPY for trading clues, and the currency pair delivered in picture-perfect style. The 15-minute chart of AUD/JPY shows a sharp decline quickly reversed by a sharp recovery.
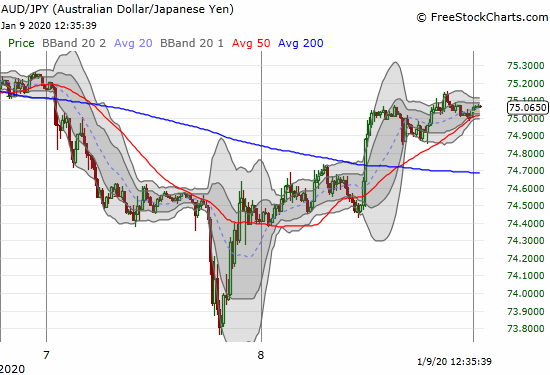
Source: FreeStockCharts
This bottom unfolded more plainly than many other bottoms. As soon as buyers strung together two consecutive 15-minute blocks of upside, the sellers lost complete control. At the same time, buyers were finally able to close a 15-minute bar above a 15-minute block of selling. The complete reversal took 2 1/2 hours. After that process ended, traders dutifully awaited further news before making their next decisive moves. That complete reversal was my confirmation that the stock market, the S&P 500 (SPY), would likely open flat to up the next morning instead of down.
The trigger-finger trading response was like raining boulders on the runway of a market with an upward bias. Reversing the losses was like clearing the runway of debris. The engines for take-off just need a spark, some catalyst for ignition. That spark came in the form of President Trump’s declaration that Iran was standing down. As a result, the U.S. would only retaliate with more economic sanctions (I was frankly surprised there is anything left to sanction!)
The daily chart for AUD/JPY shows my favorite currency pair has been in a slow, grinding uptrend as part of an extended recovery from the July/August selling. While AUD/JPY is nowhere near reaching its heights of 2019, the upward trajectory from the August low correlates with the upward trajectory for the S&P 500 over the same time.
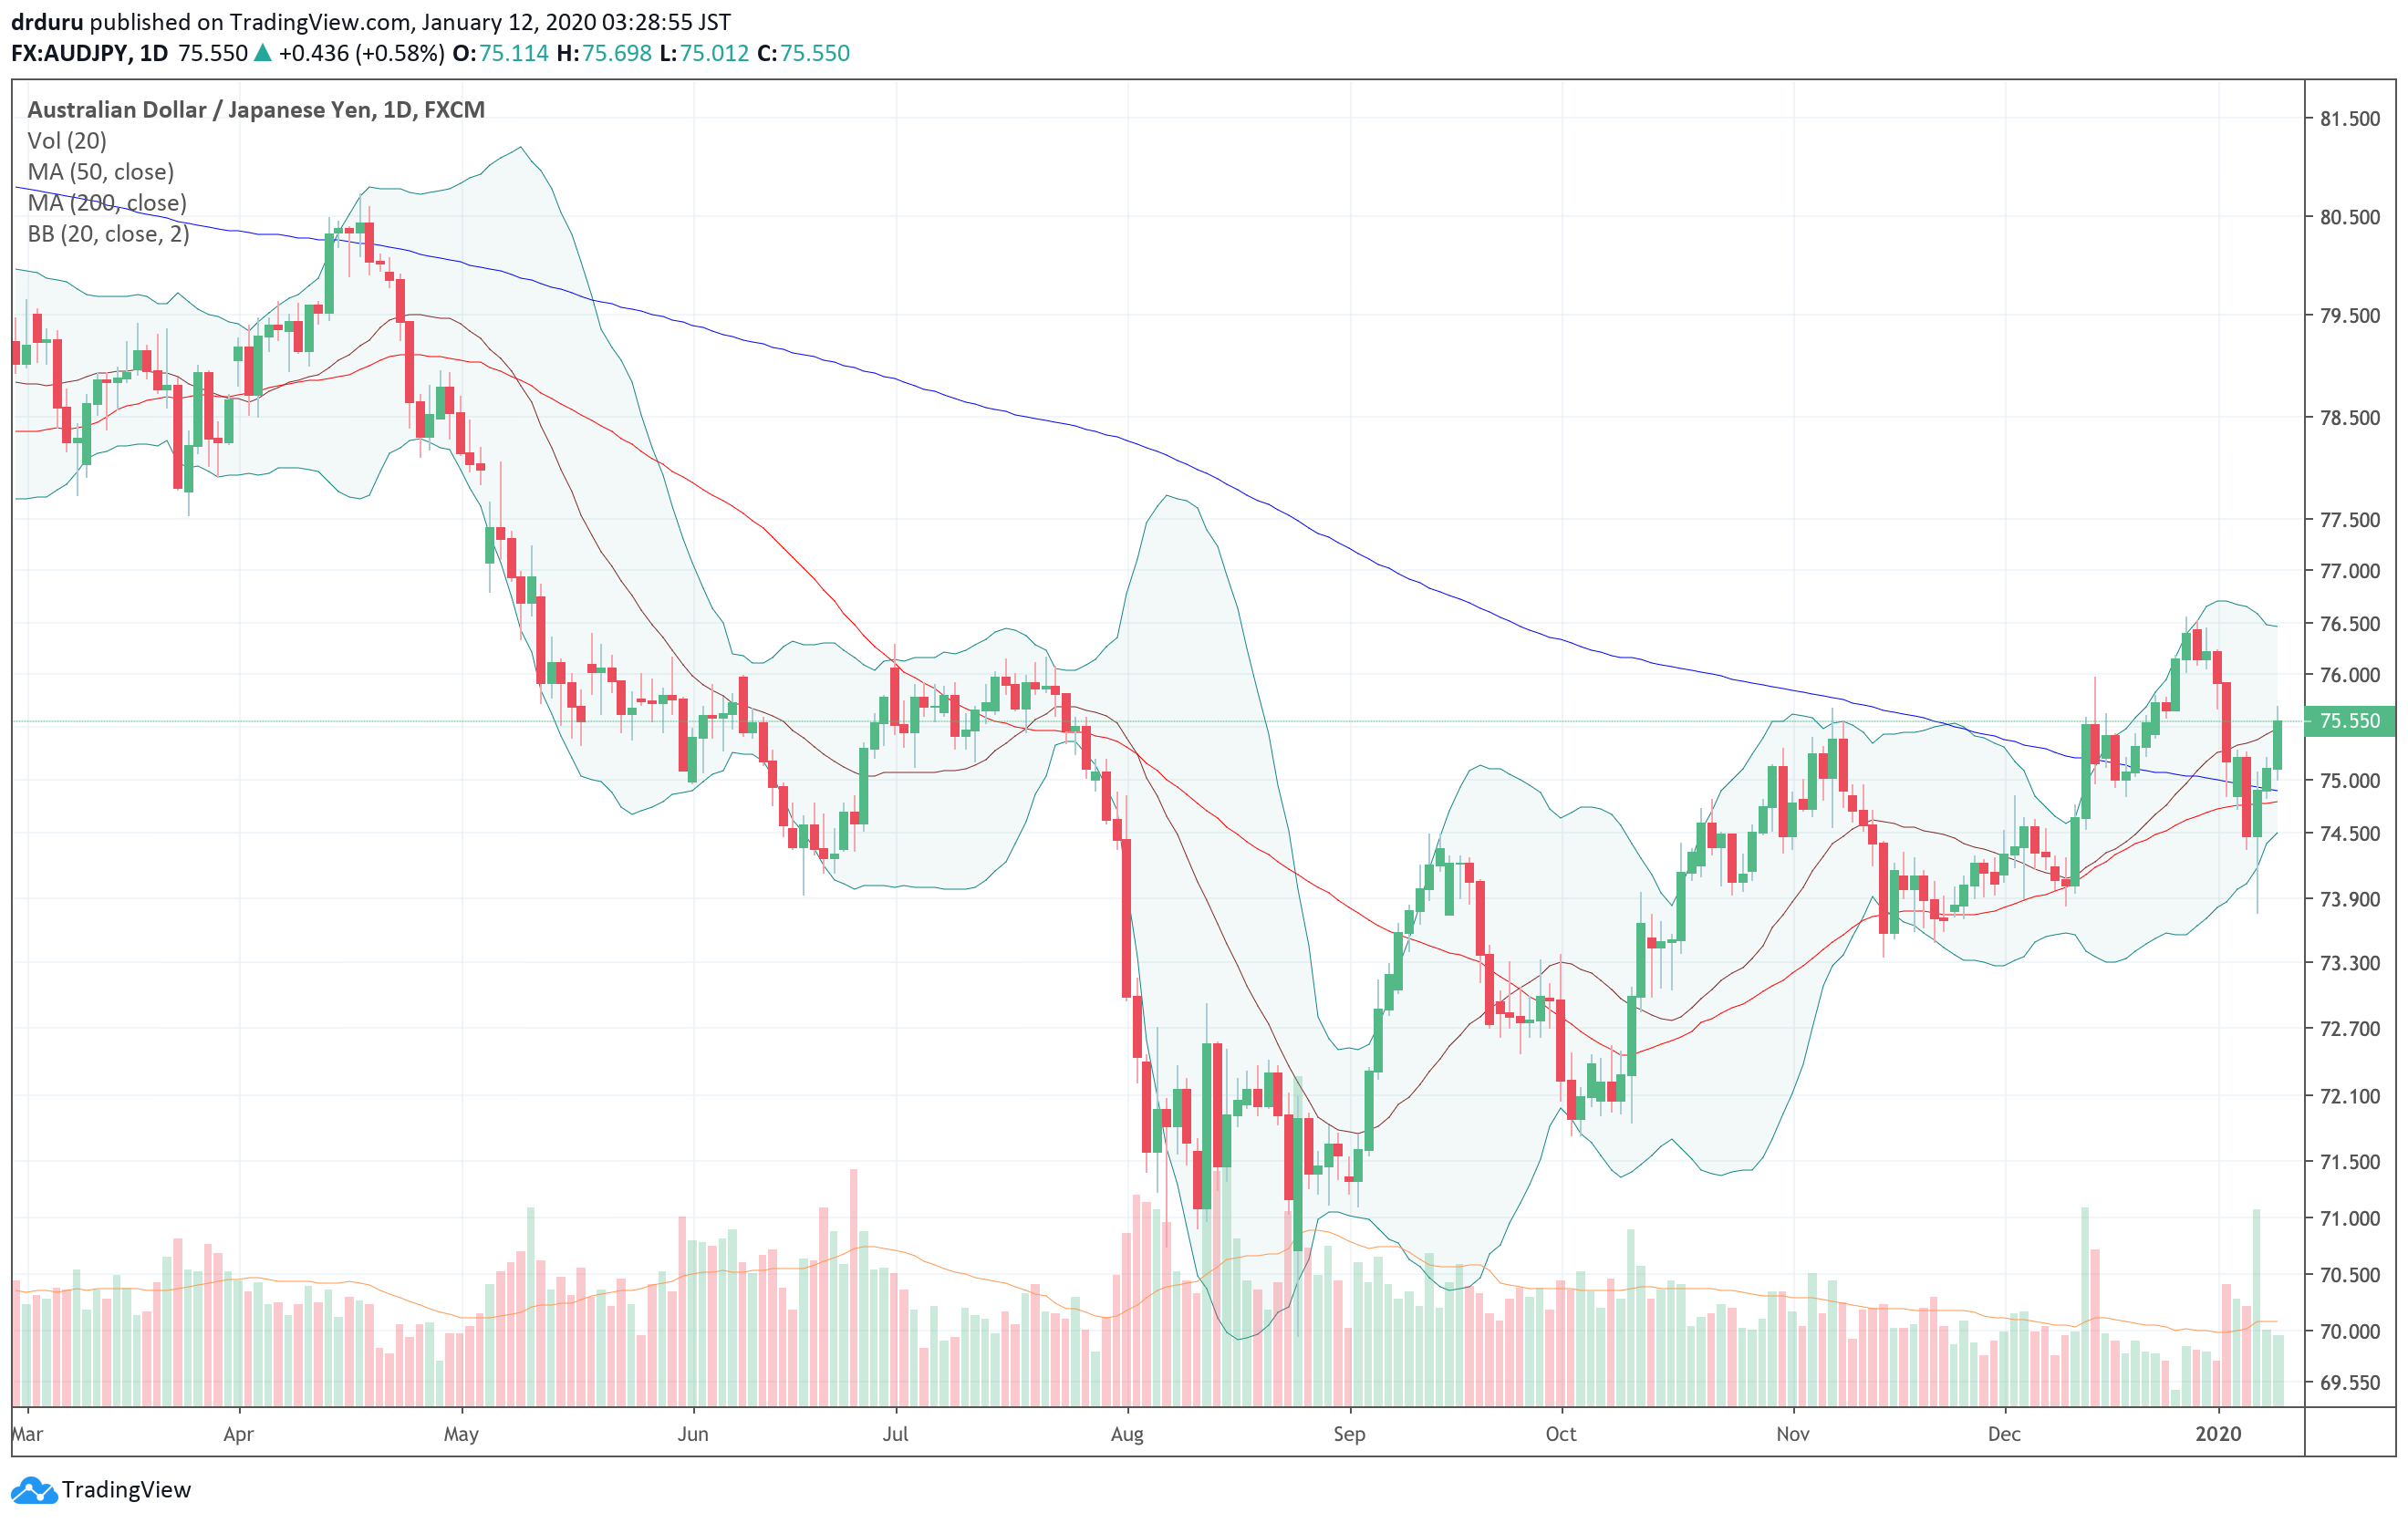
Source: TradingView.com
When AUD/JPY broke out above its 200-day moving average (DMA), I dumped my short position which I was using as a hedge against bullishness. I am now back to trading AUD/JPY on much shorter time-frames. I reopened a short position betting that AUD/JPY will re-challenge converging support from the 50 and 200DMAs.
Be careful out there!
Full disclosure: short AUD/JPY