
The Federal Reserve’s program of monetary tightening has been fighting the bond market since the process began about 3 years ago. Over that period, the Fed has painstakingly tried to hike rates in a way that would avoid roiling markets. Unfortunately for the Fed, long-term rates on U.S. Treasuries failed to cooperate and barely budged over this time period. Compare the 10-year to the effective Fed Funds rate: they are converging.
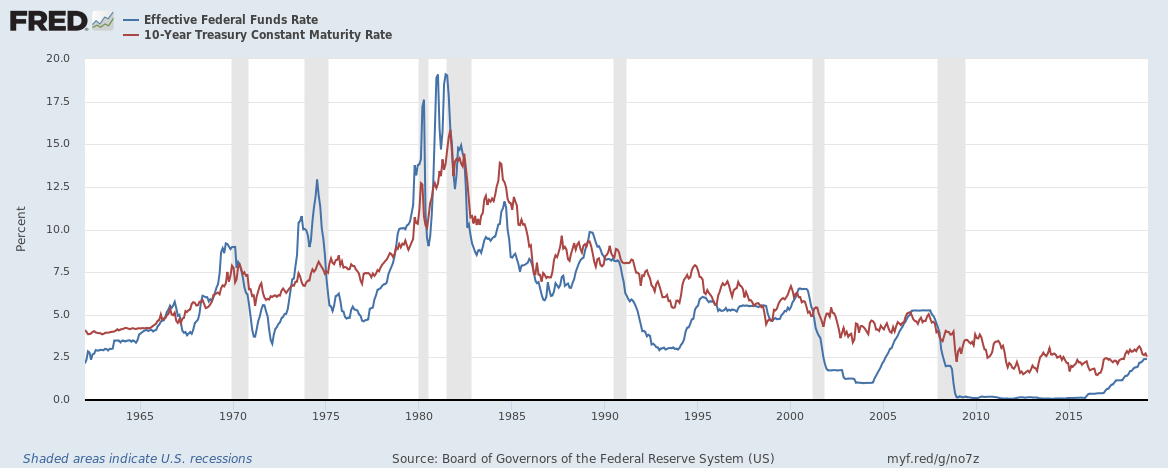
Source: Board of Governors of the Federal Reserve System (US), Effective Federal Funds Rate [DFF] and 10-Year Treasury Constant Maturity Rate [DGS10], retrieved from FRED, Federal Reserve Bank of St. Louis; March 24, 2019. (I also saved the combined chart here).
The vertical shaded bars indicate recessions as defined by the National Bureau of Economic Research (NBER). Notice the incidences of convergence in the past: they have often occurred in the months and years prior to a recession. The record is pretty consistent with exceptions for three pre-mature red flags (false positives) in May 1966, August 1980, and December 1995.
While convincing, this 10-year to Fed Funds rate correlation is not quite the way yield watchers think about the relationship of bond yields to recessions. Instead, they look at the spread between long-term and short-term bond yields. There is some confusion as to which yields matter, but I am going to use the most convincing picture I have seen: Econbrowser used the 10-year, 2-year, and 3-month to come up with this very consistent picture (the “spread” is defined as subtracting the shorter-term yield from the 10-year yield):
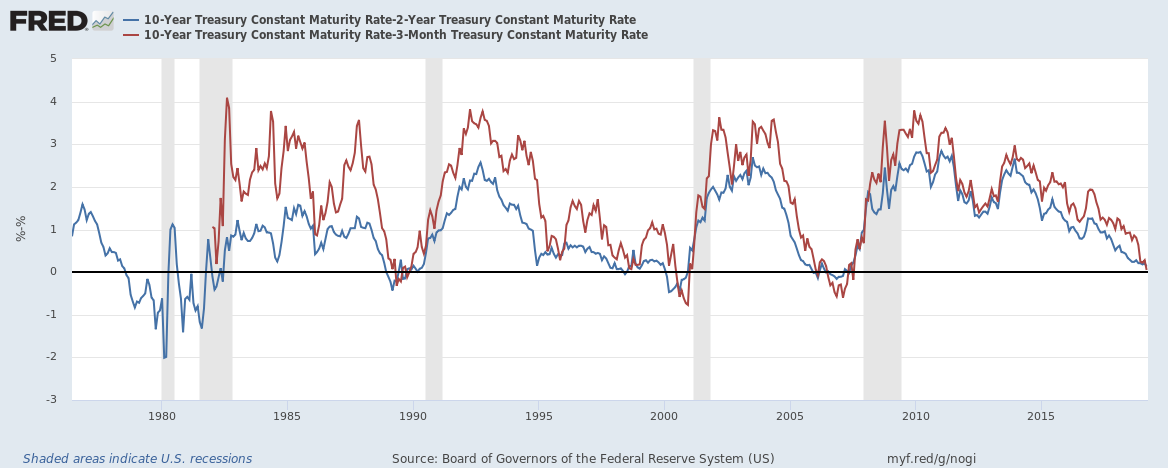
Additional Sources: Board of Governors of the Federal Reserve System (US), 2-Year Treasury Constant Maturity Rate [DGS2] and
3-Month Treasury Constant Maturity Rate [DGS3MO] retrieved from FRED, Federal Reserve Bank of St. Louis; March 24, 2019. (I also saved the combined chart here).
According to the above chart, we are “inches” away from an inverted yield curve which in turn triggers a recession warning anywhere from 10-18 months out from the warning. So I am not surprised that financial markets have steadily increased their predictions of a rate cut from the Federal Reserve. The current Fed Funds target rate is 225-250 basis points (2.25% to 2.50%). The snapshot below shows the recent history of the market’s rate prediction for December, 2019. The market essentially expects roughly even odds between rates staying the same and dropping by at least 25 basis points in December! Notice a similar repricing happened in a very sharp and abrupt way at the beginning of the year.
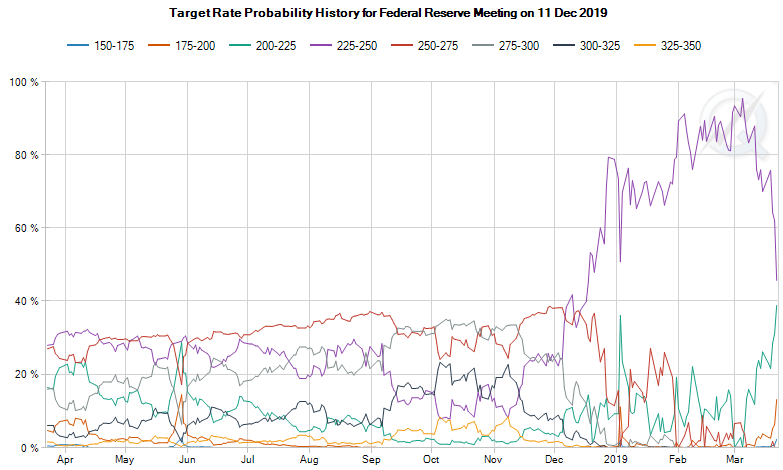
Source: CME FedWatch Tool
Economic concerns can be seen by proxy in the iShares 20+ Year Treasury Bond ETF (TLT) which trades inversely to the 20-year Treasury yield. On Friday, TLT broke out to a 14-month high.
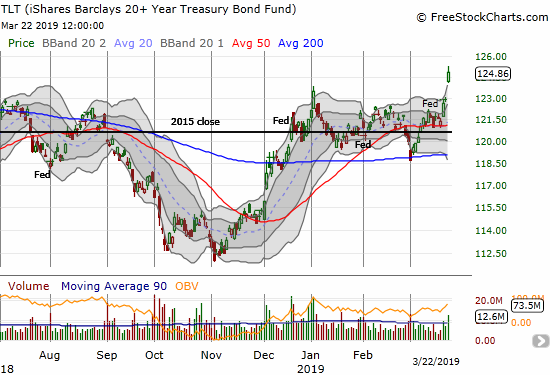
Source: FreeStockCharts.com
No matter what the pundits say on TV, the financial markets care a LOT right now about the potential for an imminent economic slowdown and even recession in the U.S. However does an inverted yield curve cause a recession or does it just predict some other cause of a recession? Econbrowser provided a timely and handy reference to EconoFact: “What Information Does the Yield Curve Yield? (UPDATED)” by the Fletcher School, Tufts University. Apparently, the pundits tend to confuse us because the professionals cannot agree on the mechanisms at work!
“While a negative spread between the 10- and 2-year Treasuries is a strong predictor of a subsequent recession, there is no single well-accepted theory of why this relationship, or more generally an inverted yield curve, predicts a recession.”
EconoFact also noted that the timelag between the inverted yield curve and the onset of a recession helps create uncertainty. For example, you might hear pundits say “this time is different” or “we see no signs of a recession anywhere on the horizon” or even “the economy looks very strong and sound right now.” Moreover, we will NEVER hear the Federal Reserve or the political party in power predict an imminent recession. Such predictions are fraught with danger because of the cost of being wrong OR right – not to mention the potential of creating a self-fulfilling prophecy of a recession as everyone slows spending and investing in preparation for a slowdown. Also consider that the dating of a recession is a technical exercise; many people experience recession-like conditions on the way to an official recession.
If a bigger economic slowdown is coming, then my bearish short-term trading call may last for much of this year. Note that the correlation between stock market returns and recessions is a lot more dicey than the correlations discussed above. The market chooses what it cares about and picks how far out it wants to price-in probable events. Currently, the S&P 500 (SPY) looks like it is in the middle of a topping process. A fresh rally is very likely to end at or around a test of the all-time high for an ominous double-top.
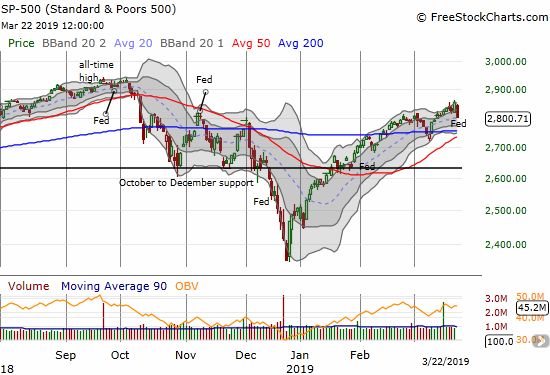
Source: FreeStockCharts.com
Be careful out there!
Full disclosure: long SPY call options, long TLT put options (note both positions are hedges)
Please check the blue line in the second picture: the spread is between the 10-year and the 3-year, not between the 10-year and the 3-month.
Great catch! I actually did the spread with the 2-year and meant to do the 3-month. Fix on the way.