
AT40 = 31.6% of stocks are trading above their respective 40-day moving averages (DMAs)
AT200 = 49.5% of stocks are trading above their respective 200DMAs
VIX = 19.1
Short-term Trading Call: bullish
Commentary
The S&P 500 (SPY) joined the NASDAQ and PowerShares QQQ ETF (QQQ) by closing above its 50-day moving average (DMA). The move was not nearly as dramatic as the previous day’s tech bumrush, but it is still significant as the stock market continues to heal from the recent oversold episodes. The S&P 500 did not achieve the milestone easily: after the index gapped up, sellers stepped in with just enough force to fill the gap and dip the index into negative territory. I decided to sell my SPY call options after buyers first failed to push SPY over the 50DMA hump. Buyers smelled the opportunity when SPY went red and led the charge to close the index above its 50DMA with a 1.2% gain.
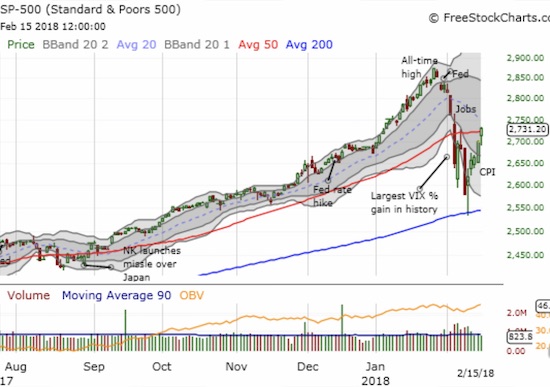
AT40 (T2108), the percentage of stocks trading above their respective 40DMAs, confirmed the resurgent bullishness by crossing above the 30% mark and closing at 31.6%. This is the first step in leaving oversold conditions (below 20%) in the rearview mirror.
The volatility index, the VIX, on the other hand did not follow-through on the previous day’s deep pullback. The VIX ended the day near flat after ranging between 17.60 and 20.66. After watching this back and forth, I decided to lock in my profits on my short iPath S&P 500 VIX ST Futures ETN (VXX) position in the after hours. I am primed to fade the next VIX rally. (For more details see “Periods of Extremely Low Volatility Remain Bullish – Now With Fresh Footnotes“).
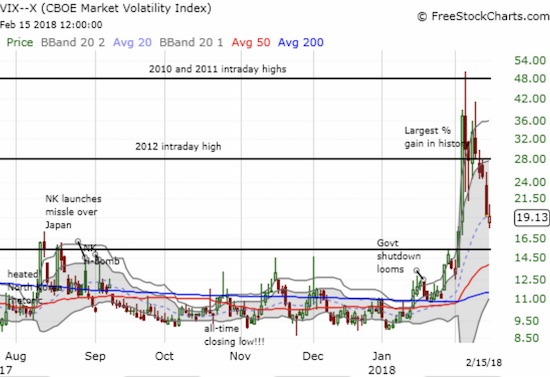
CHART REVIEWS
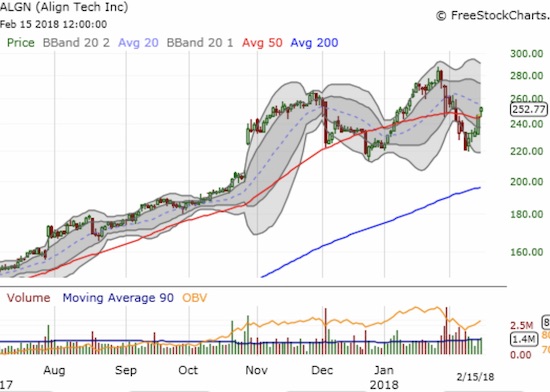
Align Technology (ALGN)
ALGN is the kind of stock I am looking to trade at this juncture: strong uptrends going into the correction and a breakout above support turned resistance. Of course stocks that never broke support and turned it into resistance are even better. I bought a call option on ALGN.
— – —
FOLLOW Dr. Duru’s commentary on financial markets via email, StockTwits, Twitter, and even Instagram!
“Above the 40” uses the percentage of stocks trading above their respective 40-day moving averages (DMAs) to assess the technical health of the stock market and to identify extremes in market sentiment that are likely to reverse. Abbreviated as AT40, Above the 40 is an alternative label for “T2108” which was created by Worden. Learn more about T2108 on my T2108 Resource Page. AT200, or T2107, measures the percentage of stocks trading above their respective 200DMAs.
Active AT40 (T2108) periods: Day #3 over 20%, Day #1 over 30% (ending 8 days under 30%), Day #10 under 40%, Day #10 under 50%, Day #11 under 60%, Day #17 under 70%
Daily AT40 (T2108)
")
Black line: AT40 (T2108) (% measured on the right)
Red line: Overbought threshold (70%); Blue line: Oversold threshold (20%)
Weekly AT40 (T2108)

*All charts created using freestockcharts.com unless otherwise stated
The charts above are my LATEST updates independent of the date of this given AT40 post. For my latest AT40 post click here.
Related links:
The AT40 (T2108) Resource Page
You can follow real-time T2108 commentary on twitter using the #T2108 or #AT40 hashtags. T2108-related trades and other trades are occasionally posted on twitter using the #120trade hashtag.
Be careful out there!
Full disclosure: long UVXY puts, long ALGN call
*Charting notes: FreeStockCharts.com uses midnight U.S. Eastern time as the close for currencies. Stock prices are not adjusted for dividends.
Addendum: I forgot to note that I sold my EEM calls as well.